


 177 / 253

165
recorded: up to 56% of youths between the ages of 12 and 17 years were enrolled in secondary
school compared to 44%, 35% and 24% in 2008, 2003 and 1990 respectively. Gender parity has
been achieved in primary in many southern states but gaps remain in favour of boys in most
northern states. Despite overall progress, low primary school attendance remains widespread
in the North East and North West geopolitical zones, which was about half school attendance
rates in southern geopolitical zones (NPC & RTI, 2015). Similarly, the Education Management
Information System (EMIS) data shows that while there has been a general increase in
enrolment, disaggregated data suggest a persistent shortcoming in the net enrolment rates
(FME, 2017). The EMIS data shows a steady decrease in primary enrolment between 2013 and
2016, with -1.37% in 2014 and -1.39% in 2015. During the same period, enrolment in junior
secondary schools fluctuated. Increase in junior secondary enrolment was noticed in 2013 and
2014 (16.89% and 0.48% respectively) while decreasing in 2015 and 2016 (-2.65% in 2015 and
-1.28% in 2016. The senior secondary level increased throughout except 2016 when it dropped
wit -8.87% (see table 3.4.1). FME (2017) attributes the decrease in enrolment to ongoing
violence and insurgency in some northern parts of the country and unavailable data from states,
indicating the need to treat the data with caution.
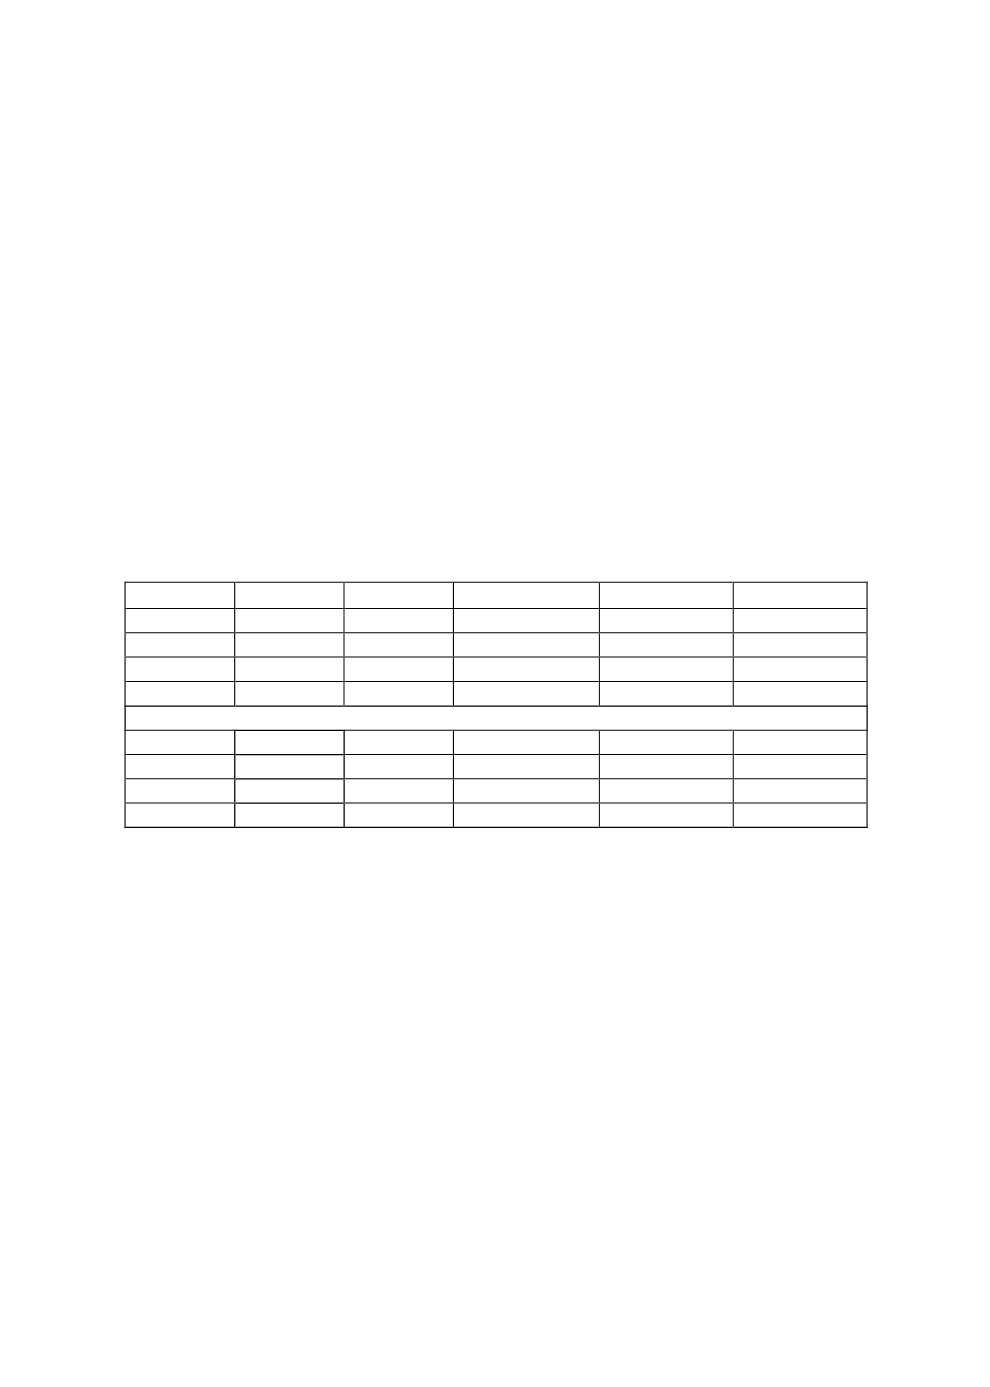
Table 3.4.1: Enrolment By Level Of School For The Years 2012 To 2016 And % Change In The
Enrolment
2012
2013
2014
2015
2016
PRY 1-6
24,893,442 26,158,375
25,801,197
25,442,535
25,591,181
JS 1-3
5,277,527
6,168,764
6,203,094
6,180,291
5,968,142
PRY 1 - JS3
30,170,969 32,327,139
32,004,291
31,622,826
31,559,323
SS 1-3
4,934,722
5,152,805
4,292,489
4,910,944
4,475,309
Percentage
change
PRY 1-6
-
5.08
-1.37
-1.39
0.58
JS 1-3
-
16.89
0.48
-2.65
-1.28
PRY 1 - JS3
-
14.45
0.55
-0.37
-3.55
SS 1-3
-
4.42
16.7
14.41
-8.87
Source: FME (2017). * The actual enrolment rates are not provided
EMIS data is not disaggregated by economic quintiles but the 2015 Multiple Indicator Cluster
Survey (MICS) data shows that the lowest economic quintile, representing the poorest in the
economic category of the society had almost twice lower primary school net enrolment ratio
(NER) than the second quintile and the higher the economic level the higher the NAR. As
Figure
3.4.1
shows, the lowest and second quintile respectively had 34% and 61%NAR while the forth
and highest quintiles respectively had 78% and 84%NAR. The Gross Enrolment Ratio (GAR) for
the lowest quintile stood at 50% while the highest quintile stood at 99% (National Population
Commission (NPC) & Research Triangle Institute (RTI), 2016). A similar trend is observed at the
junior secondary school (JSS) level where the lowest quintile had only 9%NAR while the highest
quintile had up to 62% NAR. The JSS GAR for the poorest level of the society was 19 while the
highest quintile was 87%, indicating that the poor still have very low access to education (see
Figure 3.4.1
).