


 22 / 277

Education of Disadvantaged Children in OIC:
The Key to Escape from Poverty
12
in the high-income group (See Figure 1). In Sub-Saharan Africa the adjusted primary net
enrolment rate increased from 59 percent in 1999 to 79 percent in 2012. Yet it remains the most
disadvantaged region in the world in terms of school enrolment rates. Overall, progress in
enrolment rates has stalled in the last decade. According to UNESCO estimates, this signals that
the universal primary education goal in the SDGs may not be reached by 2030.
27
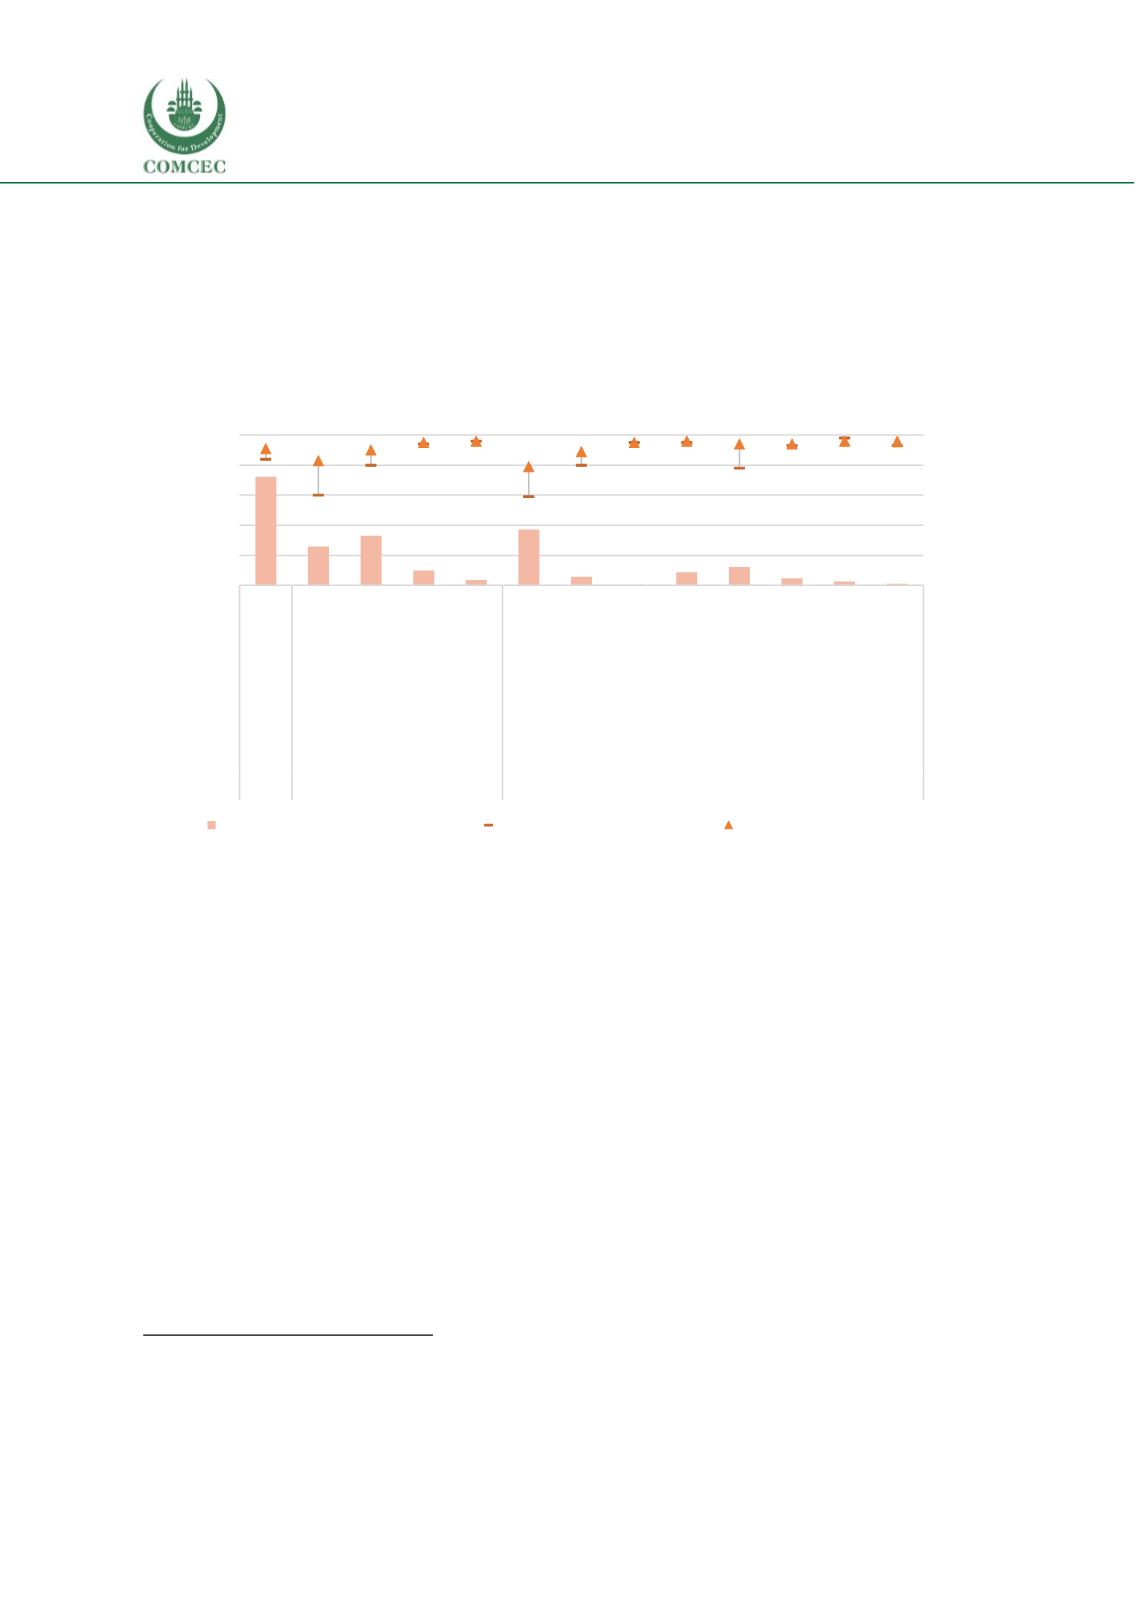
Figure 2 Adjusted primary net enrolment rate (left axis) and number of out of school
children of primary school age (right axis), by income group and region
Source: UNESCO (2015)
Currently millions of primary school age children are out of school across the world.
About 58 million children of primary school age were out of school in the world as of 2012 (See
Figure 1). A great majority of out-of-school children live in Sub-Saharan Africa where 30 million
children were out of school as of 2012. The number of out of school children is high in other
regions as well with South and West Asia having 10 million and East Asia and the Pacific having
7 million out of school children. In some countries, over 1 million primary school age children
are out of school. In Nigeria, Pakistan, India, Sudan, Ethiopia, and Indonesia the number of out
of school children are 8.7, 5.6, 2.9, 2.7, 2.1, and 2.0 million, respectively.
28
27 (UNESCO, 2016b)
28 (UNESCO, 2016d)
57,8
20,7
26,3
7,9 2,8
29,6
4,5 0,3 6,9 9,8 3,8 2,1 0,8
0
20
40
60
80
0
20
40
60
80
100
World
Low income
Lower middle income
Upper middle income
High income
Sub-Saharan Africa
Arab states
Central Asia
East Asia and the Pacific
South and West Asia
Latin America and the
Caribbean
North America and
Western Europe
Central and Eastern Europe
Income level
Region
number of out of school children (in millions)
Adjusted primary net enrolment rate (%)
Number of out of school children - 2012 Adjusted net enrolment rate - 1999 Adjusted net enrolment rate - 2012