


 155 / 277

Education of Disadvantaged Children in OIC:
The Key to Escape from Poverty
145
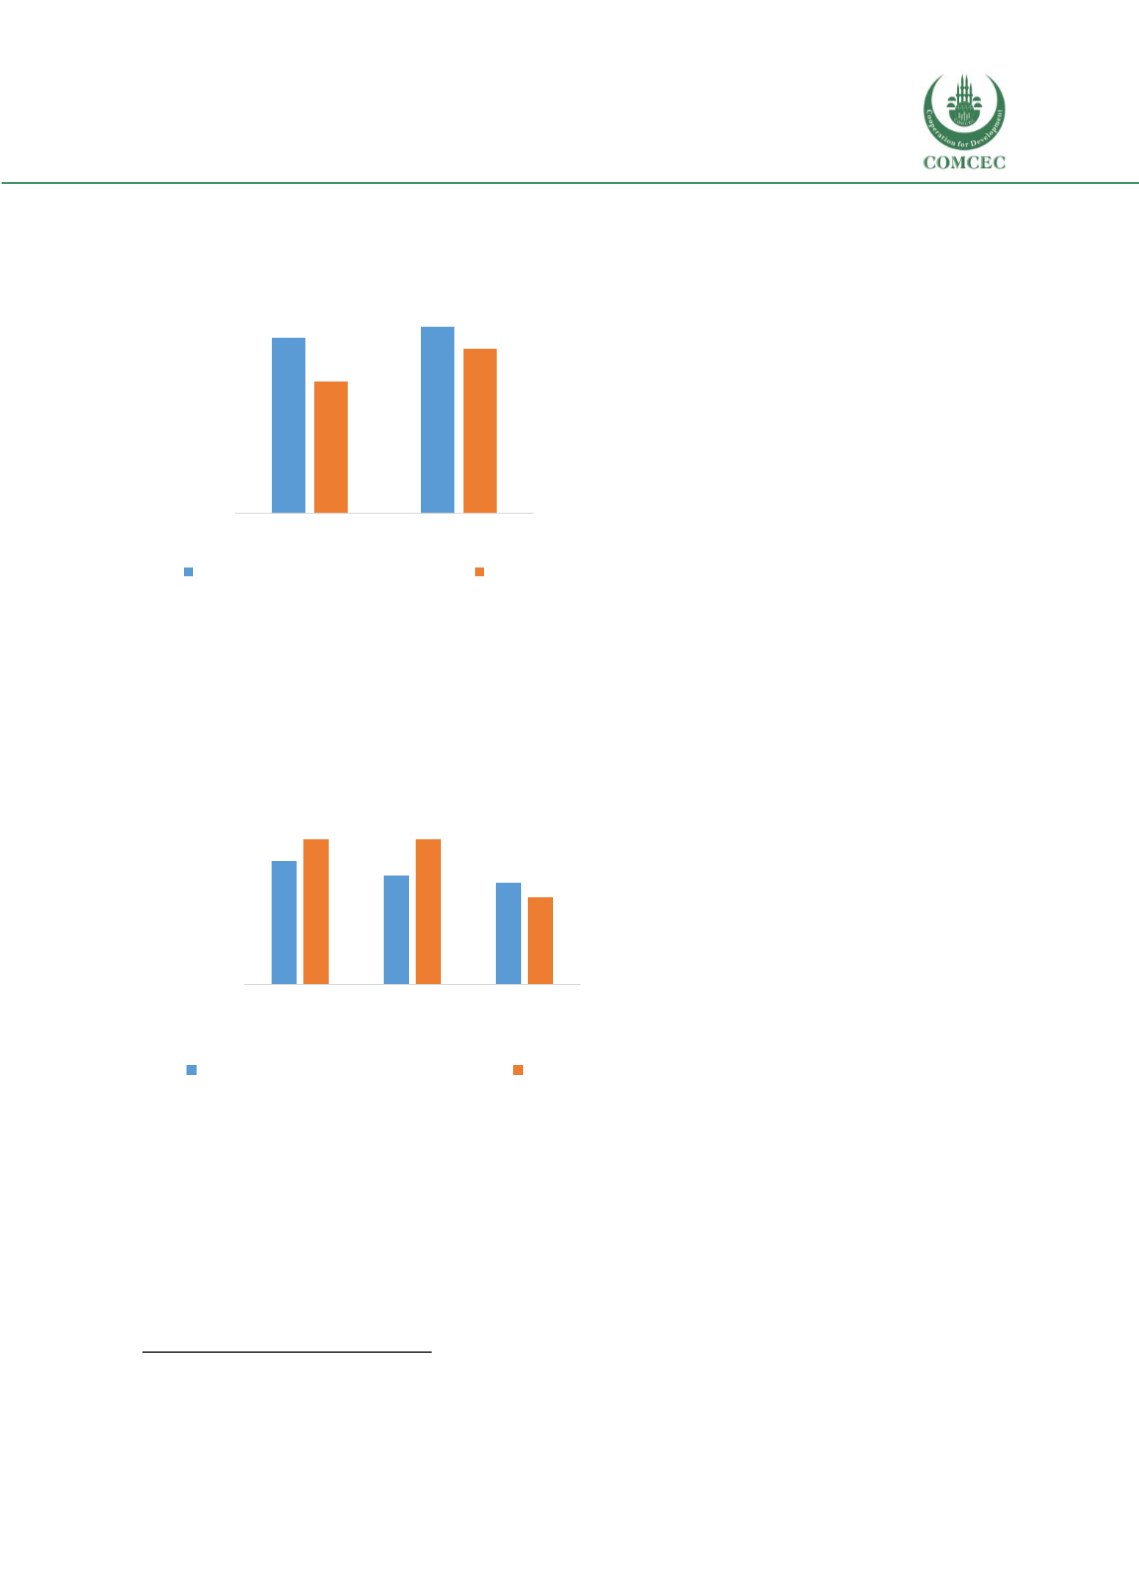
In terms of resource allocation, according
to the EPDC Jordan 2014 report
392
,
Jordan’s per pupil expenditure (PPE) in
primary education is 12 percent. It is
therefore below the median PPE in
primary
for
upper
middle-income
countries which is 16 percent.
While Jordan is trying to decrease its debt
to GDP ratio and thus adopting fiscal
tighteningmeasures, education should not
be a sector affected by those measures. On
the contrary, spending could be increased
to be on par with other countries at similar
level of economic development. Jordan
spends less per pupil at the primary level
than at the secondary level. While the details of spending are not available, generally speaking
spending in secondary level per pupil
is higher as teachers’ salaries are higher and more materials
are needed for the curriculum of later school grades.
The pupil teacher ratio (PTR) can be
considered not only a proxy for learning
quality also as a resource availability
indicator. In that respect, Jordan’s pupil
teacher ratio (PTR) is 19.9, therefore on
average there is one teacher for every
19.9 primary school students. The higher
the number, the more students the
teacher needs to supervise and the lower
the ‘resources available’.
Jordan’s primary PTR is above 17, the
median PTR in primary for upper middle-
income countries. Consequently, in
Jordan there are fewer ‘resources’ available i.e. there are fewer teachers available than in other
upper middle-income countries (in line with the PPE trends). Similarly, the secondary PTR is
higher than the primary PTR so more resources are invested at the secondary level (also in line
with the PPE trends).
392
https://www.epdc.org/sites/default/files/documents/EPDC%20NEP_Jordan.pdfFigure 53. Per pupil expenditure by school level
(% of GDP per capita)
Source: UNESCO Institute for Statistics (UIS)
Figure 54 Pupil teacher ratio by school level
Source: UNESCO Institute for Statistics (UIS)
16
17
12
15
0
2
4
6
8
10
12
14
16
18
Primary
Secondary
% of GDP per capita
Upper middle income countries (median) Jordan
17
15
14
20
20
12
0
5
10
15
20
25
Primary
Lower
secondary
Upper
secondary
Pupil teacher ratio
Upper middle income countries (median) Jordan