
Increasing Broadband Internet Penetration
In the OIC Member Countries
119
principal technology for accessing Internet. The countries in this group include Kuwait, Libya,
Tunisia, Lebanon, Egypt, Cote d’Ivoire, Indonesia, Morocco, Nigeria, Gabon, Kirgizstan, Senegal,
Sudan, Mauritania and Uzbekistan. The countries in groups C are at lower levels of economic
development and, consequently, at an embryonic stage of adoption of either broadband
technology. Nations in this group include Afghanistan, Bangladesh, Benin, Burkina Faso,
Cameroon, Chad, Comoros, Djibouti, Guinea, Guinea-Bissau, Gambia, Iraq, Mali, Mozambique,
Niger, Pakistan, Sierra Leone, Somalia, Syria, Tajikistan, Togo, Turkmenistan, Uganda, and
Yemen. Finally, the three countries in group D (Guyana, Palestine, and Brunei) are at an initial
stage of mobile broadband adoption and expected to move to either group A or B in the future.
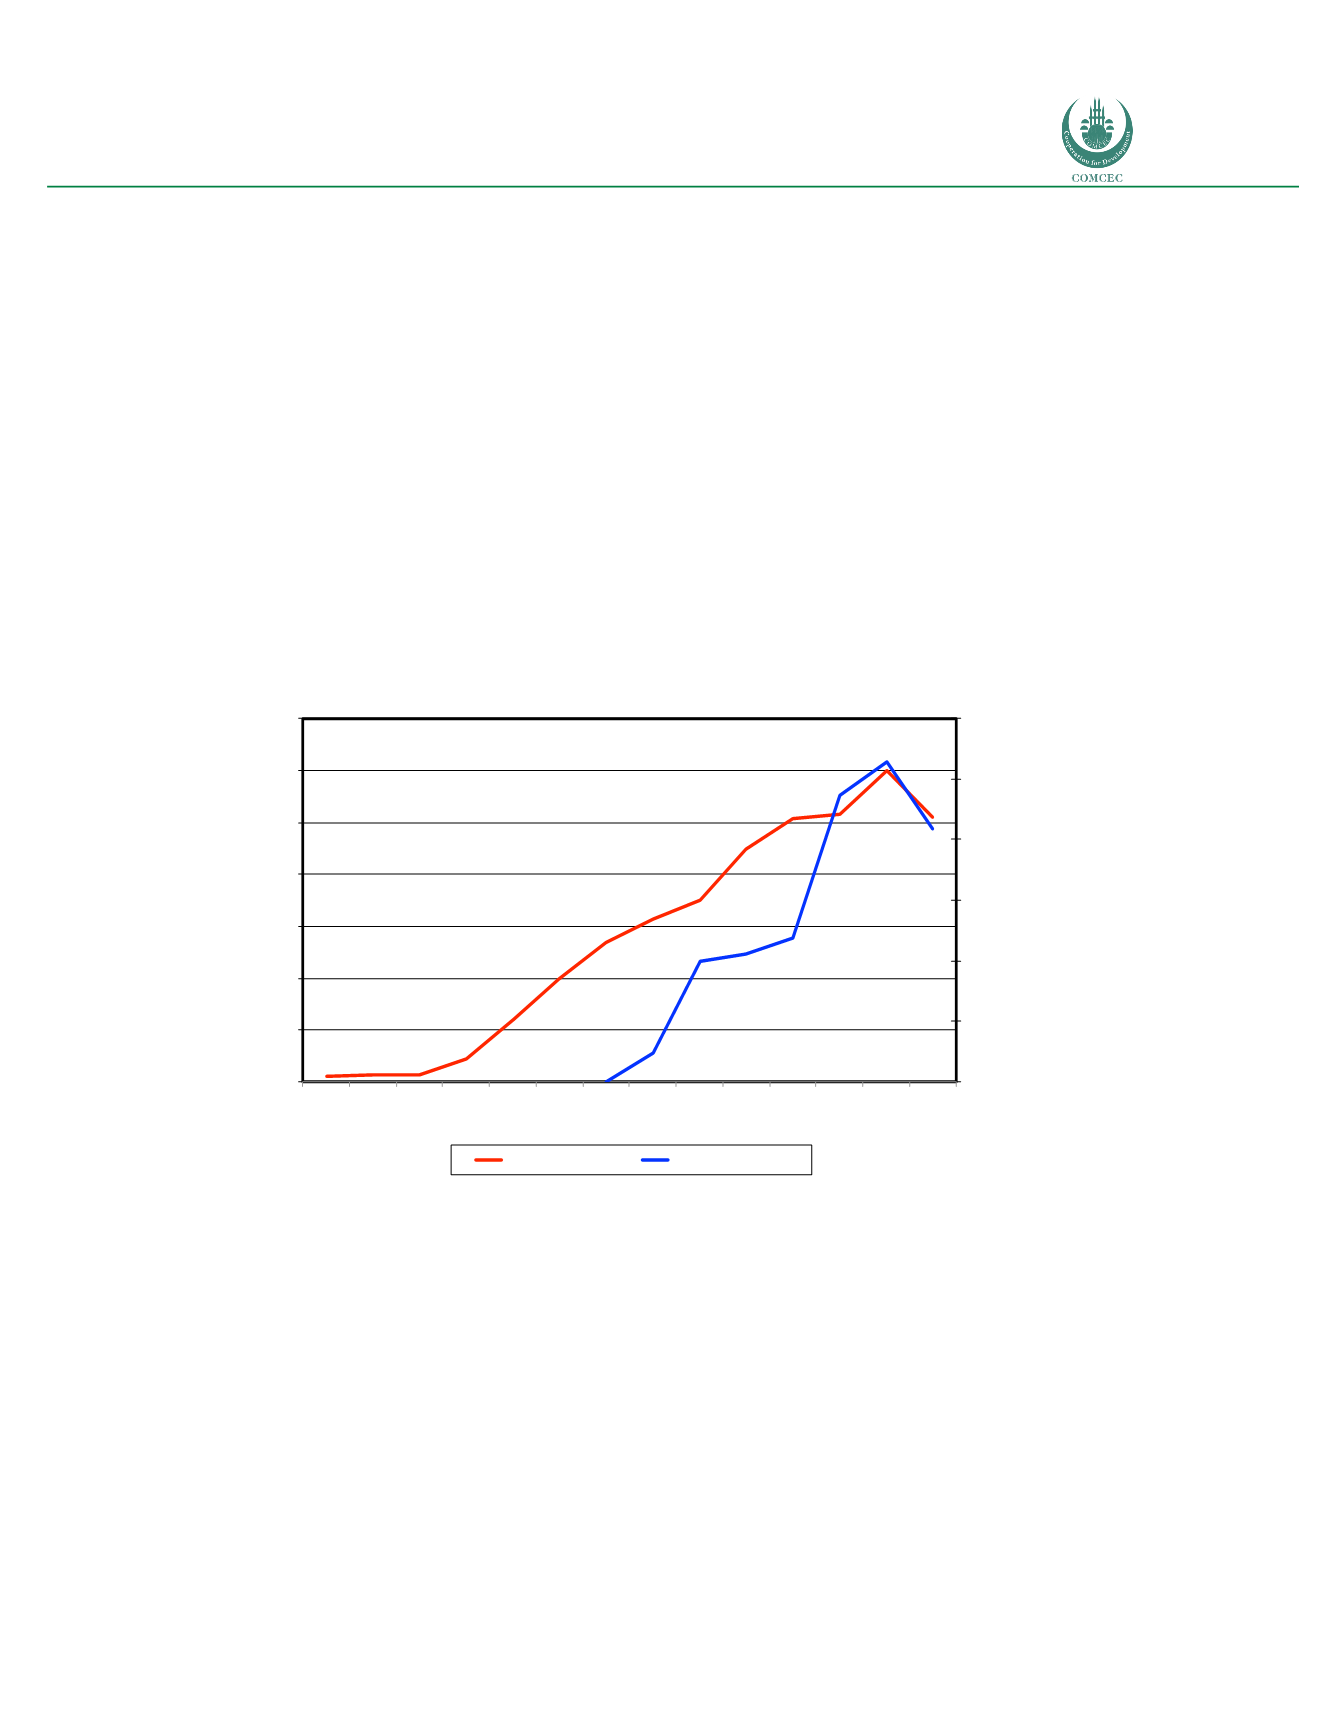
While Saudi Arabia represents a country with high adoption of fixed and mobile broadband
technologies, the comparative analysis of adoption trends between both access technologies
indicates a clear substitution pattern, whereby mobile is capturing share from fixed broadband
(see figure 34).
Figure 34: Saudi Arabia: Comparative adoption of fixed and mobile broadband (2003-2016)
Source: Telecom Advisory Services analysis.
Figure 34 depicts several trends affecting the diffusion of fixed and mobile broadband in the
country. The first trend is a ramp-up in fixed broadband adoption between 2011 and 2013.
This acceleration occurs at the same time that mobile broadband penetration is not increasing
at a fast pace. This would indicate that fixed broadband is capturing a large portion of the
latent demand. The second trend depicts a slow down in fixed broadband penetration between
2012 and 2014. This occurred because fixed broadband subscriber growth was inhibited by
the substitution effect of mobile broadband driven by more competitive plans, such as
unlimited packages, coupled with easier setup and the mobility advantage. In fact, while fixed
broadband prices remained comparable to global and local benchmarks, mobile plans were
relatively cheaper (see pricing analysis below).
0.20% 0.29% 0.27%
0.86%
2.40%
3.98%
5.37%
6.28%
7.03%
8.98%
10.13% 10.32%12.01% 10.23%
9.70%
39.60% 42.10%
47.60%
94.50%
105.90%
83.50%
0%
20%
40%
60%
80%
100%
120%
0%
2%
4%
6%
8%
10%
12%
14%
2003
2004
2005
2006
2007
2008
2009
2010
2011
2012
2013
2014
2015
2Q2016
Fixed Broadband
Mobile Broadband
Fixed&Broadband&
(Percent&of&popula5on)&
Mobile&Broadband&
(Percent&of&popula5on)&


