


 98 / 186

Urban Transport in the OIC Megacities
88
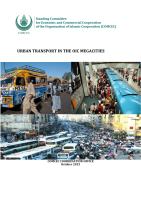
Figure 27: Metro ridership and coverage in cities across the world (World Bank)
Source: Slide 394 Prof Khaled El Araby International Symposium February 2013
4.2.5.
Freight and Servicing
Data on freight specifically for the GCR was not made available and therefore data for Egypt as a whole
is presented as a guide to the current situation in GCR. The freight transport system in Egypt is
dominated by road transport with a share of 96%, while opportunities for more energy efficient rail
and inland waterway transport are underutilized. This reliance on road freight causes congestion and
accidents. Based on available data, the table below shows the increase in road freight since 1992.
Table 8: Increase in road freight since 1992
Mode/
Year
(%)
1992
2002
2005
2006
Road
92.8%
97%
95.4%
95.7%
Rail
5.4%
3%
4 %
3.5%
River
1.5%
0.4%
0.7%
0.8%
Source: Central Agency For Public Organization and Statistics
Table 9:Freight modal splits - comparison with other countries using 2005 data is as follows
Country/Modal
split
Road
Rail
River
Egypt
95%
4%
0.7%
Holland
33%
5%
47%
Romania
43.4%
47.4%
9.2%
Poland
55%
44%
1%
Hungary
49.4%
44.4%
6.2%
Bulgaria
43%
52%
5%
Luxemburg
79%
14%
7%
Belgium
73.2%
14.4%
12.4%
France
81%
17%
2.1%
Germany
67%
17.5%
15.5%
Source: Central Agency For Public Organization and Statistics