


 142 / 186

Urban Transport in the OIC Megacities
132
in Lagos. These roads are frequently congested with over 1 million vehicular density of over 222
vehicles/km against country average of 11 km. The average Lagos commuter spends over three hours
in traffic every day (Aleshinloye, 2014).
Lagos suffers fromalmost all known transport illnesses, which severely limit mobility and accessibility
especially to the poor. The major problems of the transport system are:
-
Absence of urban rail based- mass transit system
Currently, Lagos has only a Bus Rapid Transit (BRT) system that has been in operation since 2008.
-
Lack of transport infrastructure that connects the slums areas to the activity and employment
centres.
-
Capacity of the existing arterial road system lags behind due to a rapid annual rate of car
ownership level.
-
Poor traffic management
-
Weak institutional structure
5.1.3.
Land use and urban form
Basically the state lies on low lands, with about 17,500 ha of built up area of which residential areas
occupy the single largest proportion of 51.9%, commercial 4.8%, industrial 8.4%, institutional and
special use 13.7%, open spaces 2.6% and transportation 18.6% (Olayiwola et al., 2005). Lagos has
several central business districts (CBDs), which reflect the city’s internal structure approximating to
the “multiple nuclei structure”.
The major influencing factor on land use pattern in LMA is the physical environment. For example
much development cannot take place towards the south because of the Atlantic Ocean. The over
concentration of urban activities, the agglomeration and increased separation of residencies to work
place have created the need for daily journey to work on a massive scale (Oni, 1992).
5.1.4.
Mode availability and shares
Lagos is Nigeria’s major traffic centre and the most heavily motorized urban area in the country. In
2013, the demand for trips in LMA by all modes (including walking) was 22 million trips per day. The
rapid increase in population and standard of living will bring the daily demand for trips to 40 million
per day by 2032 (Mobereola, 2014).
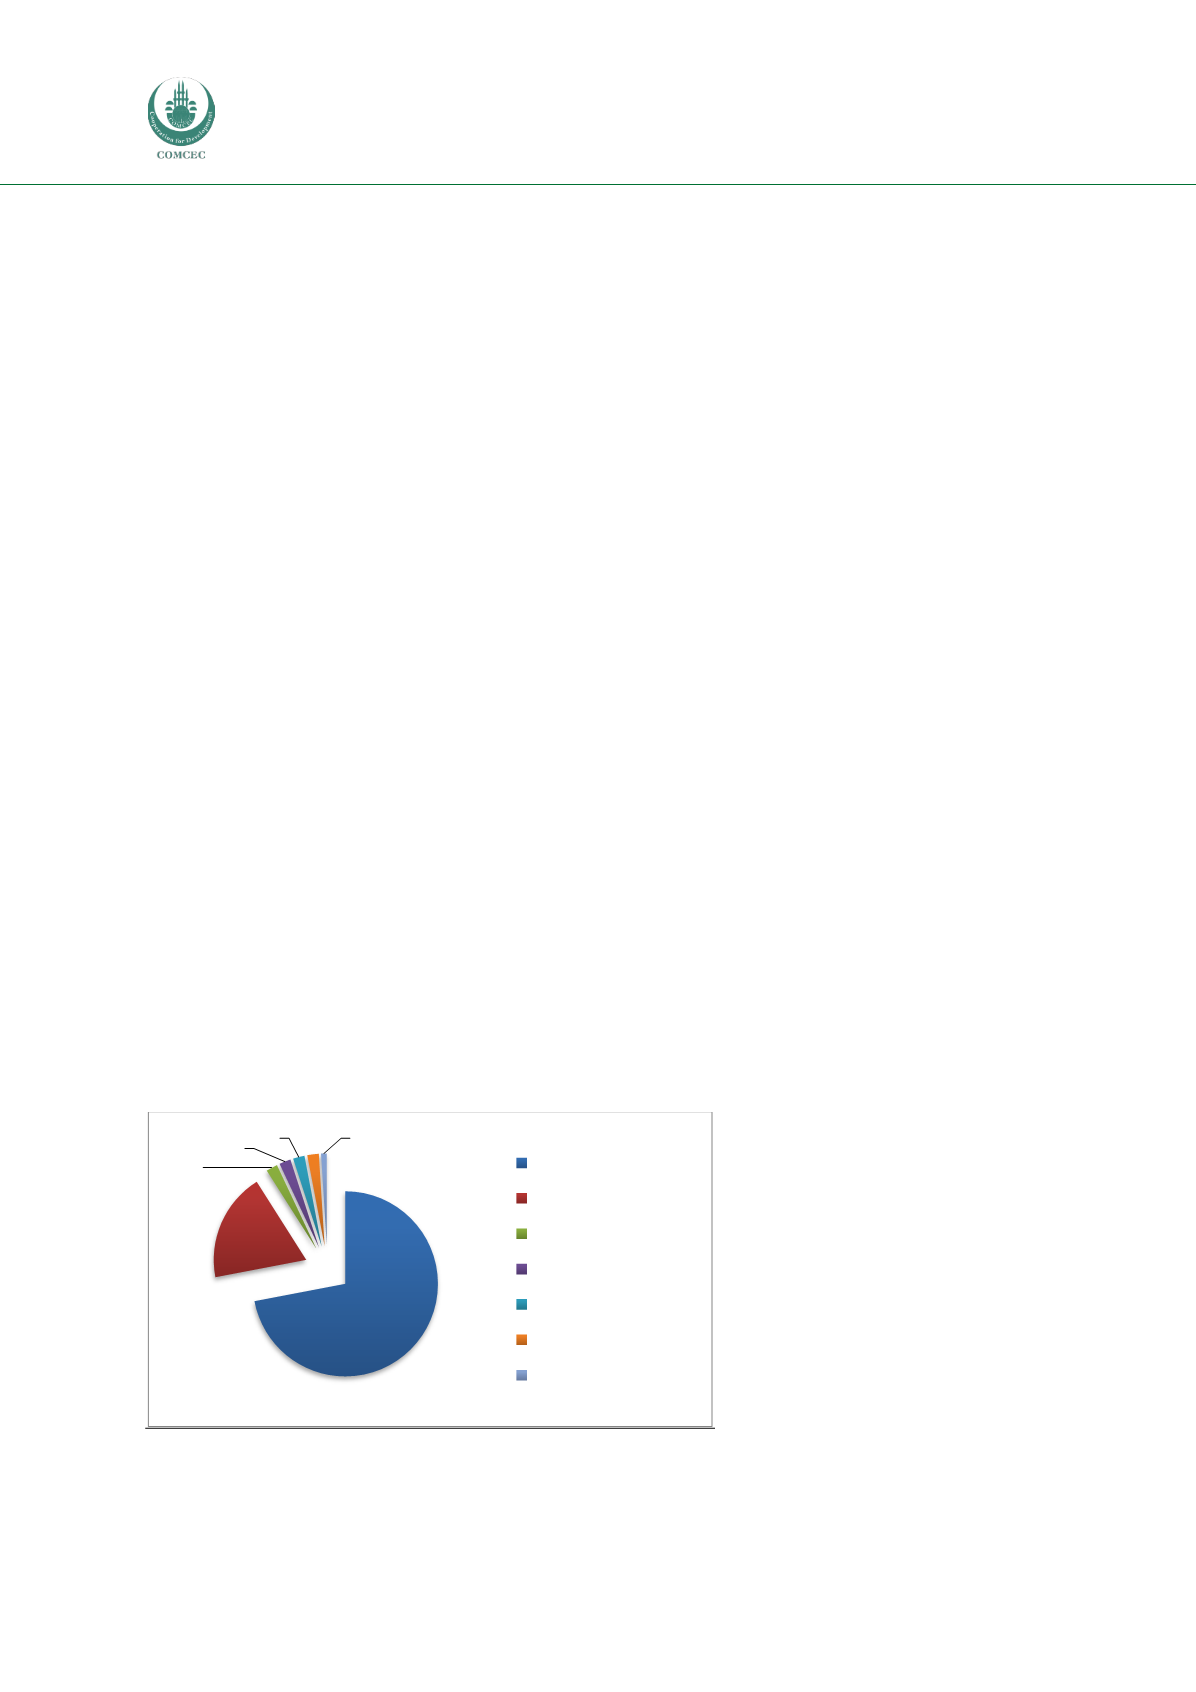
Figure 55: Observed mode share of motorized trips in LMA in 2013
Source: Consultant
5.1.4.1.
Private motorized transport
Ownership of a car or motorcycle in LMA is much more common than air conditioner or computer.
The households’ primary mode of travel is public bus which accounts for around 77% of the total
72%
19%
2%
2%
2% 2% 1%
Unregulated buses
Cars
Regulated buses
BRT
Motorcycles
Water
Rail