


 169 / 214

Improving Transnational Transport Corridors
In the OIC Member Countries: Concepts and Cases
155
The Secretariat has a staff of approximately five persons; consist of experts in land transport,
railway, and legal issues. This size is quite small; as such the Secretariat does not have
sufficient capacity. This is due to the fact that that there is no membership fee to fund the work
of the Secretariat. As a result, the INSTC Secretariat is not yet developed like that of TRACECA
or CAREC. Currently, the role of the INSTC Secretariat is more defined as a “depository state”.
This situation is also reflected in the fact that the corridor developments are not incorporated
in the Transport Master Plans of the member countries (Soleimani, 2017). The Secretariat
plays a crucial role in promoting the importance of harmonizing the INSCT developments with
the transport policy and plans of the member countries.
4.7.3.
Economic factors
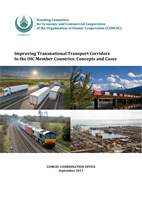
Table 52presents the EoDB of the corridor countries. Azerbaijan performs best in terms of
border compliance, while Russia is very efficient in terms of documentary compliance. Low
efficiency is observed for Iran in both categories, most probably due to the economic sanctions.
In average, the total times taken and costs of exports in the corridor countries are very high.
The average times and costs for Europe and Central Asia (except for documentary compliance
costs) are at least 50% less.
Table 52: EoDB of corridor countries in 2016
Source: World Bank
.
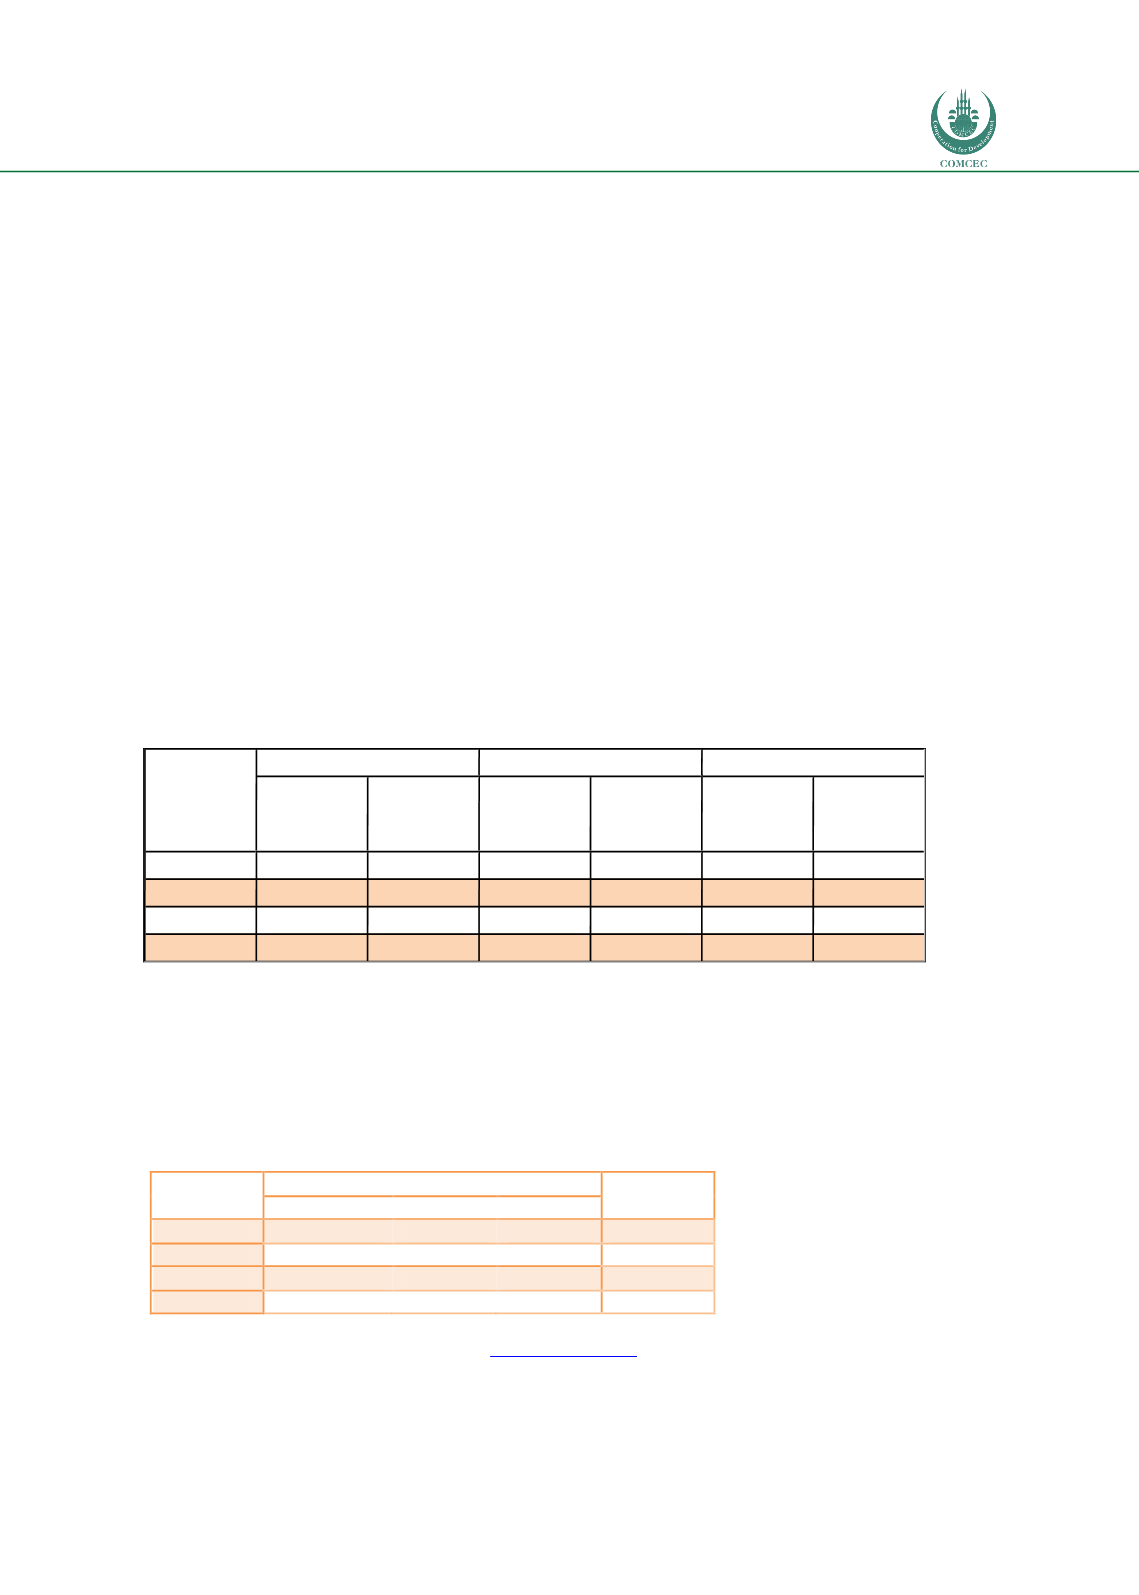
The corridor countries are mainly maritime countries, which are generally more open than
landlocked countries. However, this is not the case in INSTC, as shown in
Table 53.The
openness indices of the corridor countries are less than 50%, which shows that much of their
trade is internal most likely because they are large countries.
Table 53: Openness of corridor countries in 2016
Source: Fimotions (2017), analysis on data o
n www.trademap.org .AZER
65
152
29
214
33
300
INDIA
130
143
106
413
38
92
IRAN
120
170
101
565
152
143
RUS
40
140
96
765
25
92
Country
Ranking
Border Compliance
Overall
Trading
across
borders
Time to
export
(hours)
Cost to
export
(USD)
Time to
export
(hours)
Cost to
export
(USD)
Documentary Compliance
Country
USD Millions
Openness
GDP
Imports
Exports
AZER
53,047
9,211
11,327
38.7%
IRAN
425,326
68,319 130,544
46.8%
INDIA
2,073,543 356,704 260,326
29.8%
RUS
1,326,015 182,257 285,491
35.3%