
Muslim Friendly Tourism:
Developing and Marketing MFT Products and Services
In the OIC Member Countries
16
1
Global Tourism Trends in Products and Services and Marketing
1.1
Global Market Size
International tourism receipts have reached $1.28 trillion in 2015, an increase from $1.25 trillion
in 2014, based on 3.6 percent compound annual growth accounting for exchange rate
fluctuations and inflation, estimated from UNWTO growth statistics between 2014 and 2015.
Global outbound expenditure is expected to reach $1.85 trillion in 2020, according to estimates
using government statistics, with 6.75 percent compound annual growth, which is faster growth
than global GDP at 3.4 percent annualized. The total number of international tourist arrivals has
reached 1.18 billion in 2015, which is projected to reach 1.8 billion in 2030 with 2.9 percent
compound annual growth, according to UNWTO. The steady growth in global tourism is driven
by per capita income growth, declining global unemployment, and increasing consumer
sentiment.
4
European and North American consumers accounted for an estimated 55.4 percent of global
tourism expenditure; however, travelers from Asia, which includes MENA based tourists, are
estimated to account for a larger share of global expenditure in 2020.
5
Developing Asian
economies have also contributed to growth within the Asia and Pacific region. China has the
highest international tourism expenditure, with $102 billion, followed by countries in Western
Europe, North America, Japan and Australia. Emerging economies accounted for 46 percent of
international tourism arrivals.
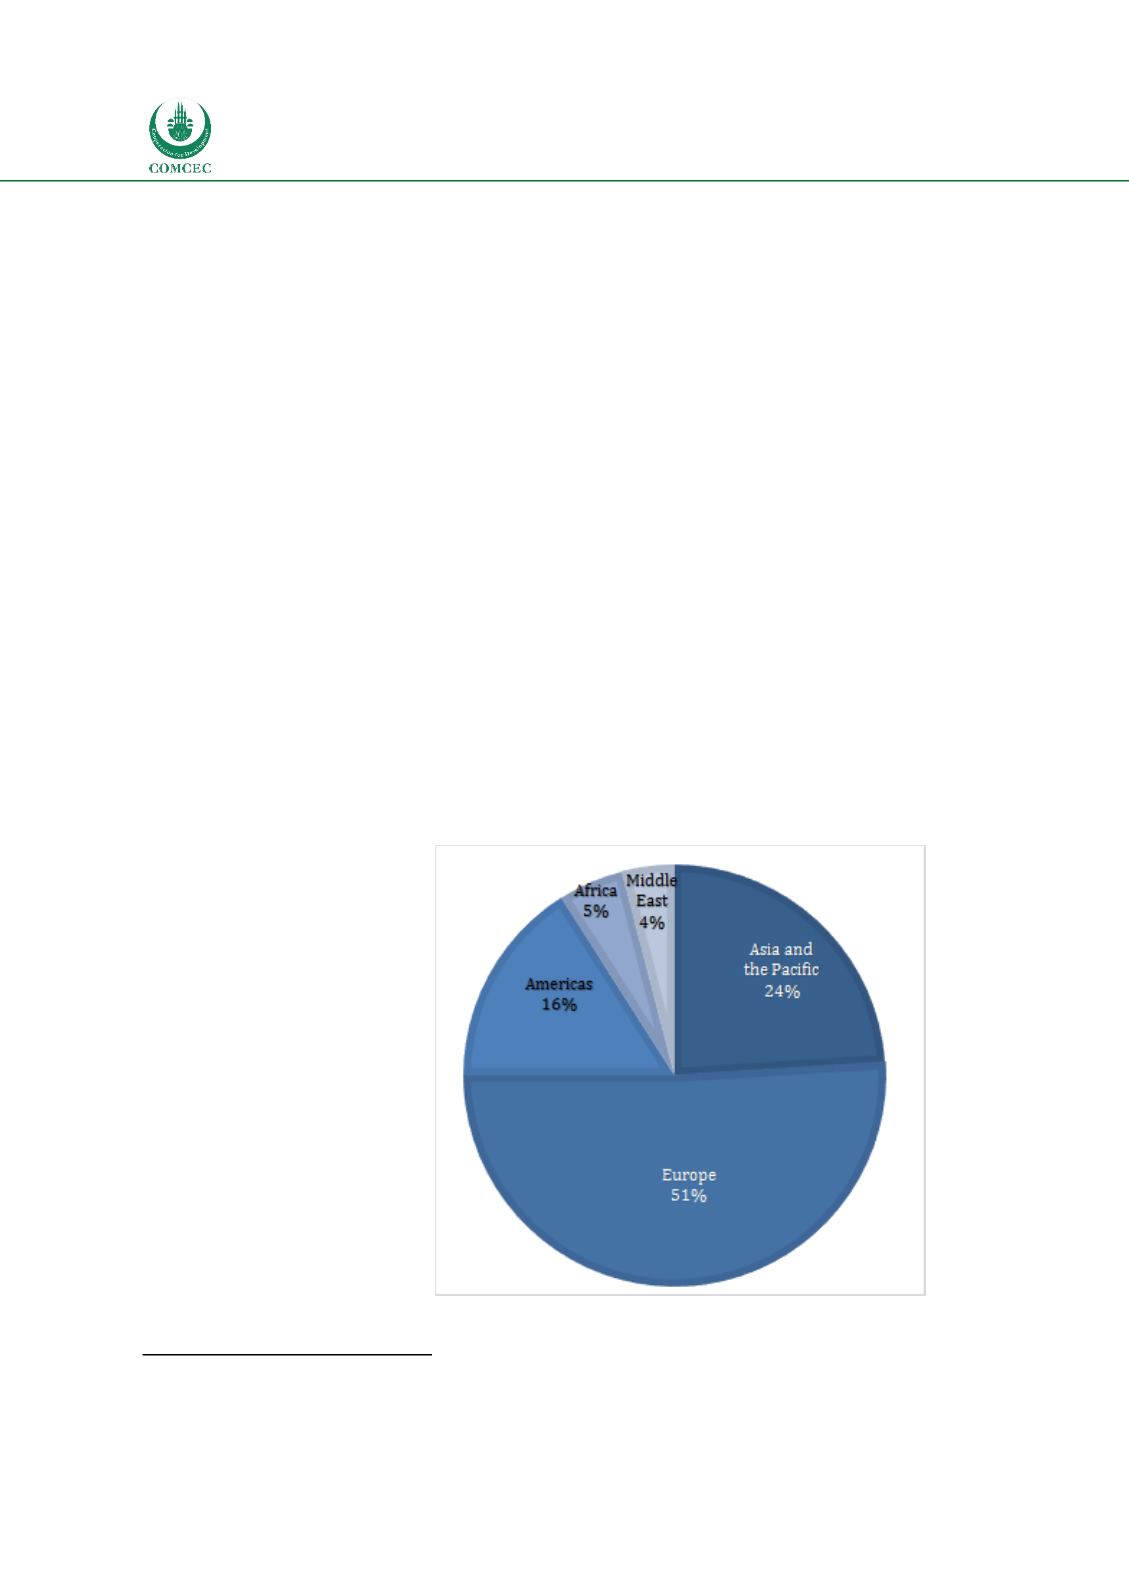
The total share of international
tourist arrivals
6
by region in
2015 includes:
Americas: 191 million,
16%
Africa: 53 million, 5%
Middle East: 53 million,
4%
Asia and the Pacific:
279 million, 24%
Europe: 608 million,
51%
Figure 1: International Tourist Arrivals in 2015
4
“Global Tourism Report.” IBISWorld, 2015.
5
UNWTO Annual Report, 2014.
6
UNWTO World Tourism Barometer, May 2016


