
Facilitating Trade:
Improving Customs Risk Management Systems
In the OIC Member States
168
Missing
2
2
2
2
2
Mean
57.066
156.425
208.636
684.293
882.522
Mode
15.990
90.000
161.000
147.000
478.000
Std. Deviation
18.354
100.356
124.386
470.583
468.805
Skewness
-0.373
1.631
0.688
2.421
0.526
Std. Error of
Skewness
0.322
0.322
0.322
0.322
0.322
80.980
575.000
568.000
2878.000
2256.000
Minimum
15.990
14.000
8.000
40.000
0.000
Maximum
96.970
589.000
576.000
2918.000
2256.000
Source: Author’s compilation
Albania ranks highest (minimum value), while Yemen ranks lowest of the 189. There is not a big
difference between the data for 2016 and those for 2017, but there are still opportunities for
improvement for many OIC MS.
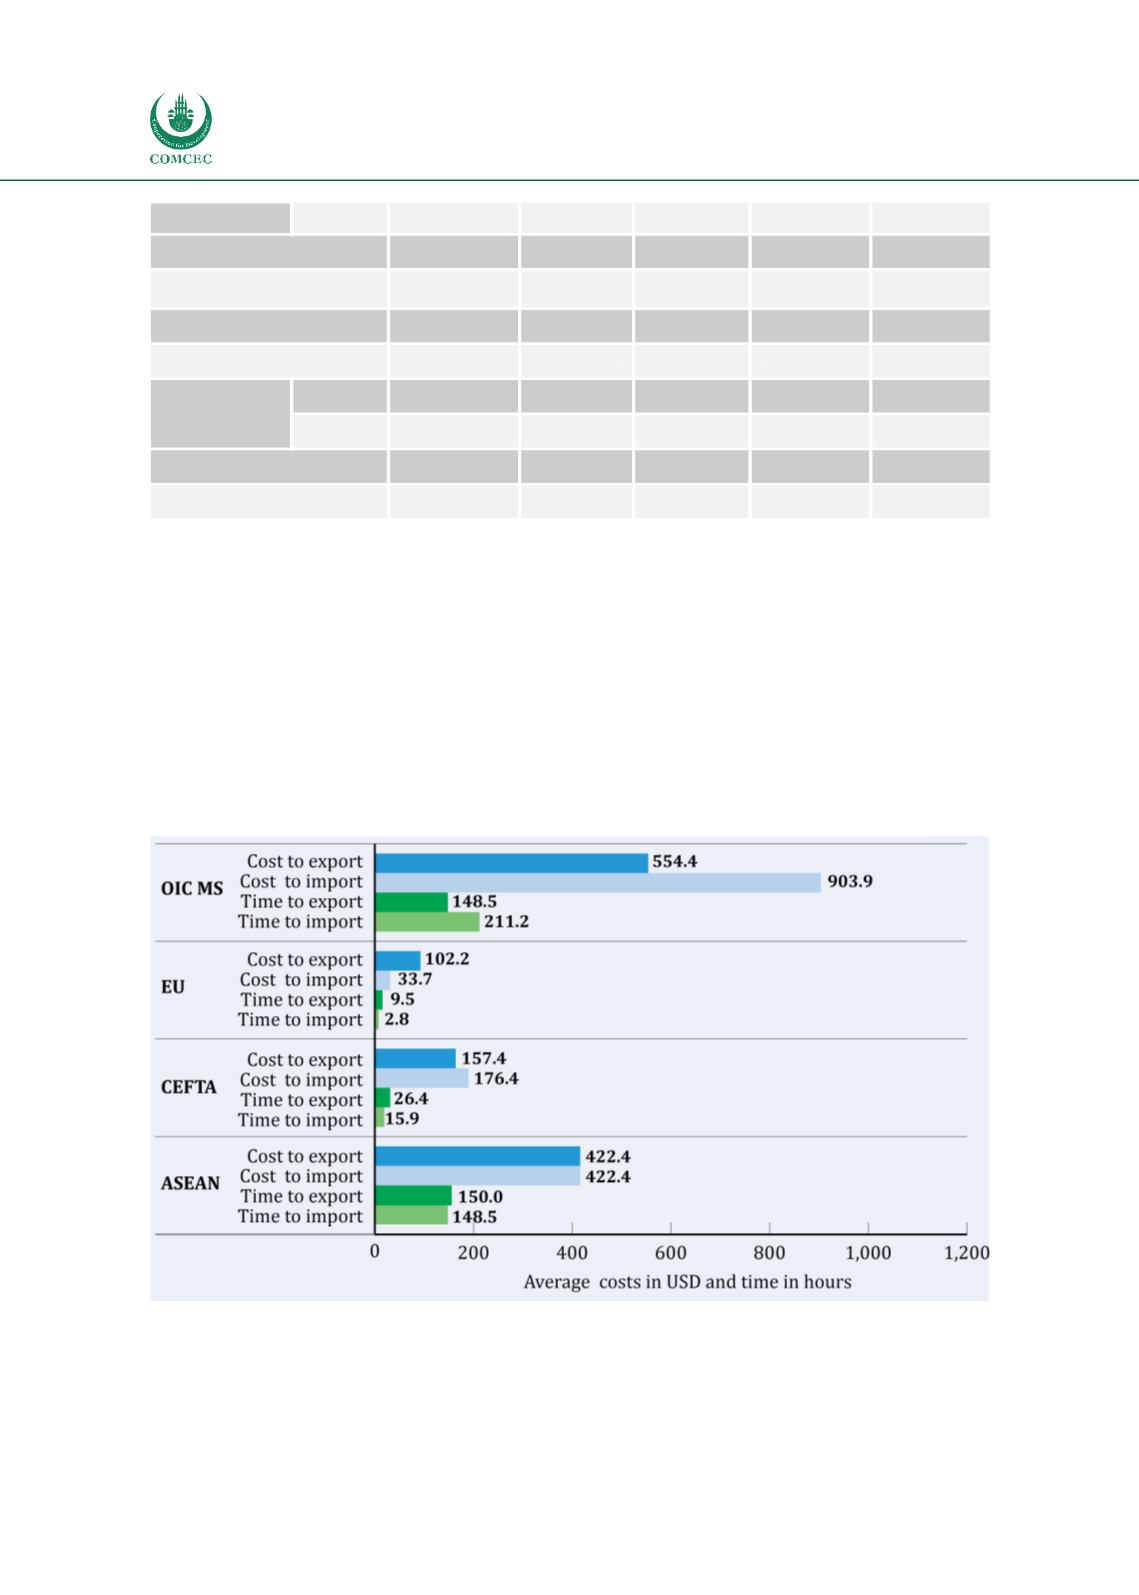
The comparative analysis of the trade costs and time to import and export on OIC MS average
level with developed countries such as EU MS shows that the average of OIC MS has higher costs
and time based on border and documentary compliance. The similar results are for the CEFTA
MS that sign the pre-accession Agreement with EU, due to the implementation of the EU acquis
related to the common EU customs domain.
Figure 60: Trade Costs and Time Comparative Analysis between OIC MS, EU, CEFTA and
ASEAN
Source: Author’s compilation
Data on time and costs for border and documentary compliance are presented in Figure 60. The
basic statistics are given i
n Table 41.There is not much difference between the data for 2016
and 2017, but there is a large difference between the best and the worst OIC MS regarding


