
Facilitating Trade:
Improving Customs Risk Management Systems
In the OIC Member States
167
7
List of Annexes
7.1
ANNEX I
World Bank's Doing Business report presents times and costs of the logistical processes for
export and import to/from countries. The costs measured exclude tariffs related costs. To
analyze current trade costs related to OIC MS the data from Doing Business - "Trading Across
Border
90
" were used-that focuses on two sets of trade costs:
Time and costs for documentary compliance related to import and export
. These
data are related to the time and the costs associated with documentary compliance
requirements of all government agencies. This shows how traders spend time and
money to prepare the number of documents that will allow them to trade across the
border. The time and cost of documentary compliance includes the time and cost of
obtaining documents, preparing documents, processing documents, presenting
documents, and submitting documents;
Time and costs for border compliance related to import and export
. Border
compliance measures the time and cost for the country's customs and other inspections,
in addition to the time and cost for handling at ports or borders. These trade costs
include time and cost related to customs clearance process and other government
inspection procedures.
The ranking of OIC MS regarding trading across the border is presented i
n ANNEX I.Albania,
Jordan, Malaysia, Morocco, Oman, and Turkey are the best-ranked countries regarding time and
costs for import and export procedures. 24 of the 56 OIC MS presented in this report rank below
the mean value
(Table 40 presents basic statistics).
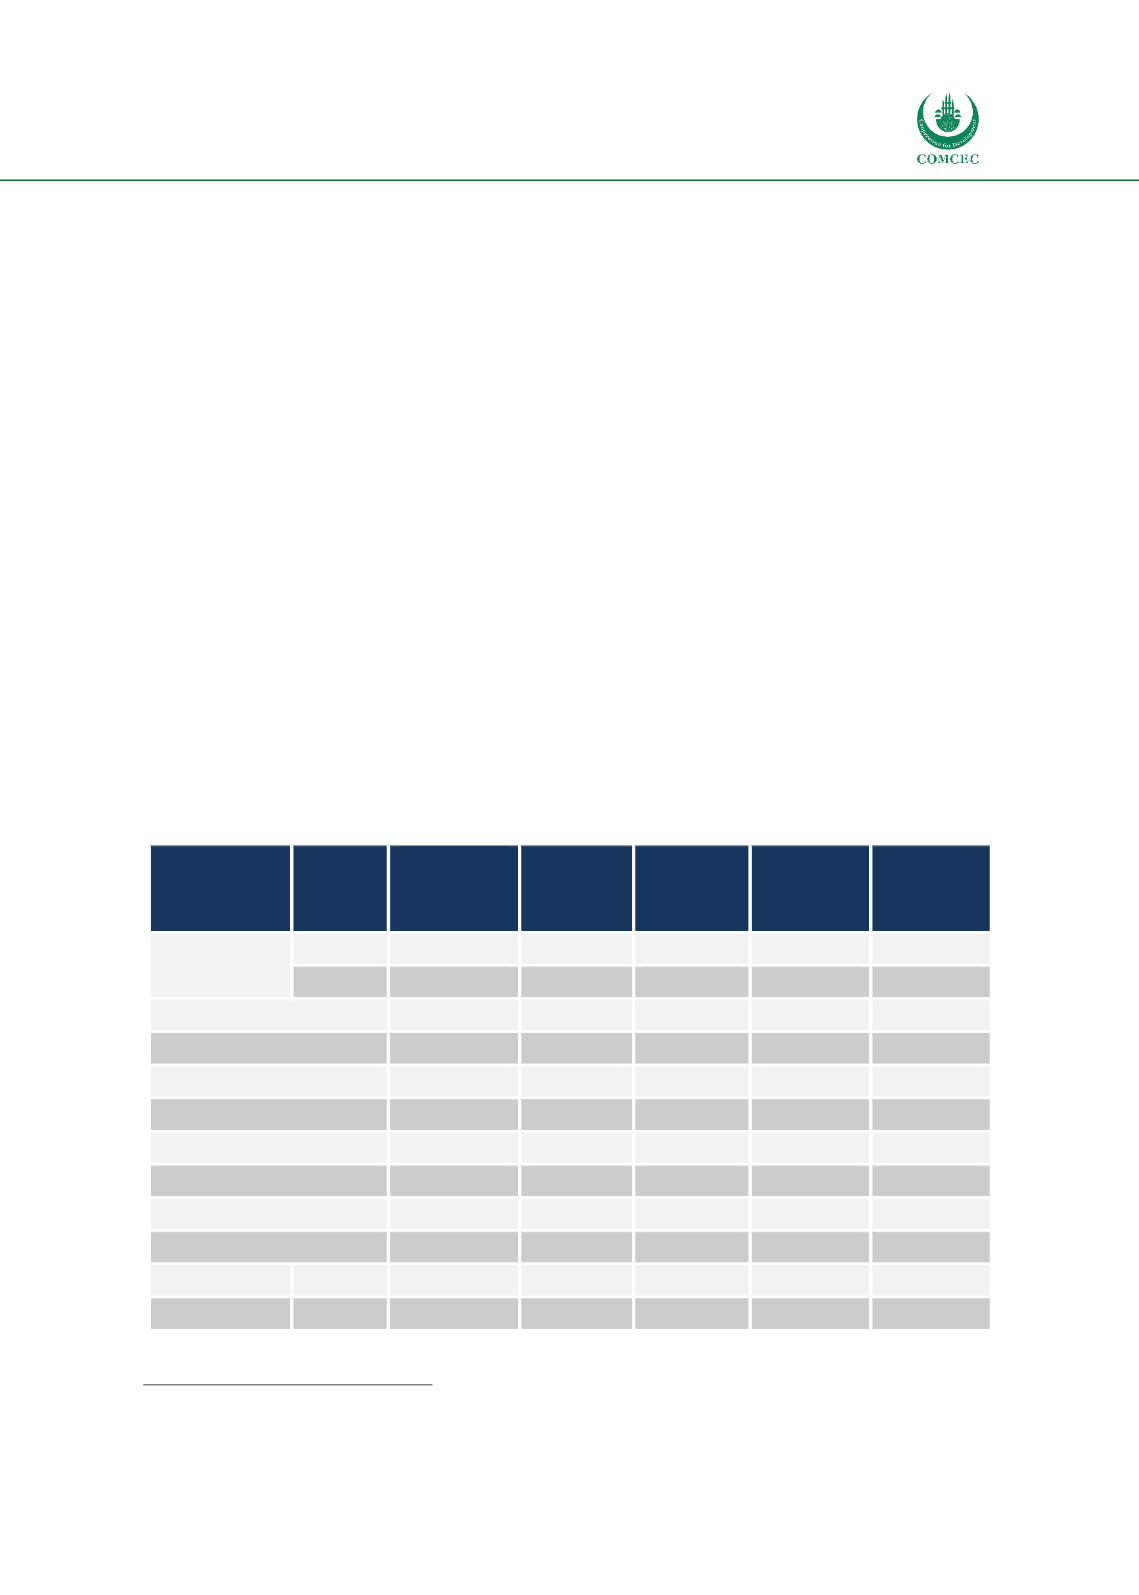
Table 40: Trading Across the Border OIC MS Basic Statistics
2017
Trading
across
Borders -
Rank
Time to
Export
Time to
Import
Cost to
Export
Cost to
Import
N
Valid
56
55
55
55
54
Missing
1
2
2
2
3
Mean
130.34
154.53
212.69
697.84
932.46
Mode
24
a
40
a
161
a
643
1169
Std. Deviation
41.021
99.599
132.127
458.054
469.701
Skewness
-0.544
1.526
0.683
2.398
0.463
Std. Error of Skewness
0.319
0.322
0.322
0.322
0.325
Range
165
558
568
2753
2169
Minimum
24
15
8
65
87
Maximum
189
573
576
2818
2256
2016
N
Valid
55
55
55
55
55
90
http://www.doingbusiness.org/data/exploretopics/trading-across-borders


