
Strengthening the Compliance of the OIC Member States
to International Standards
67
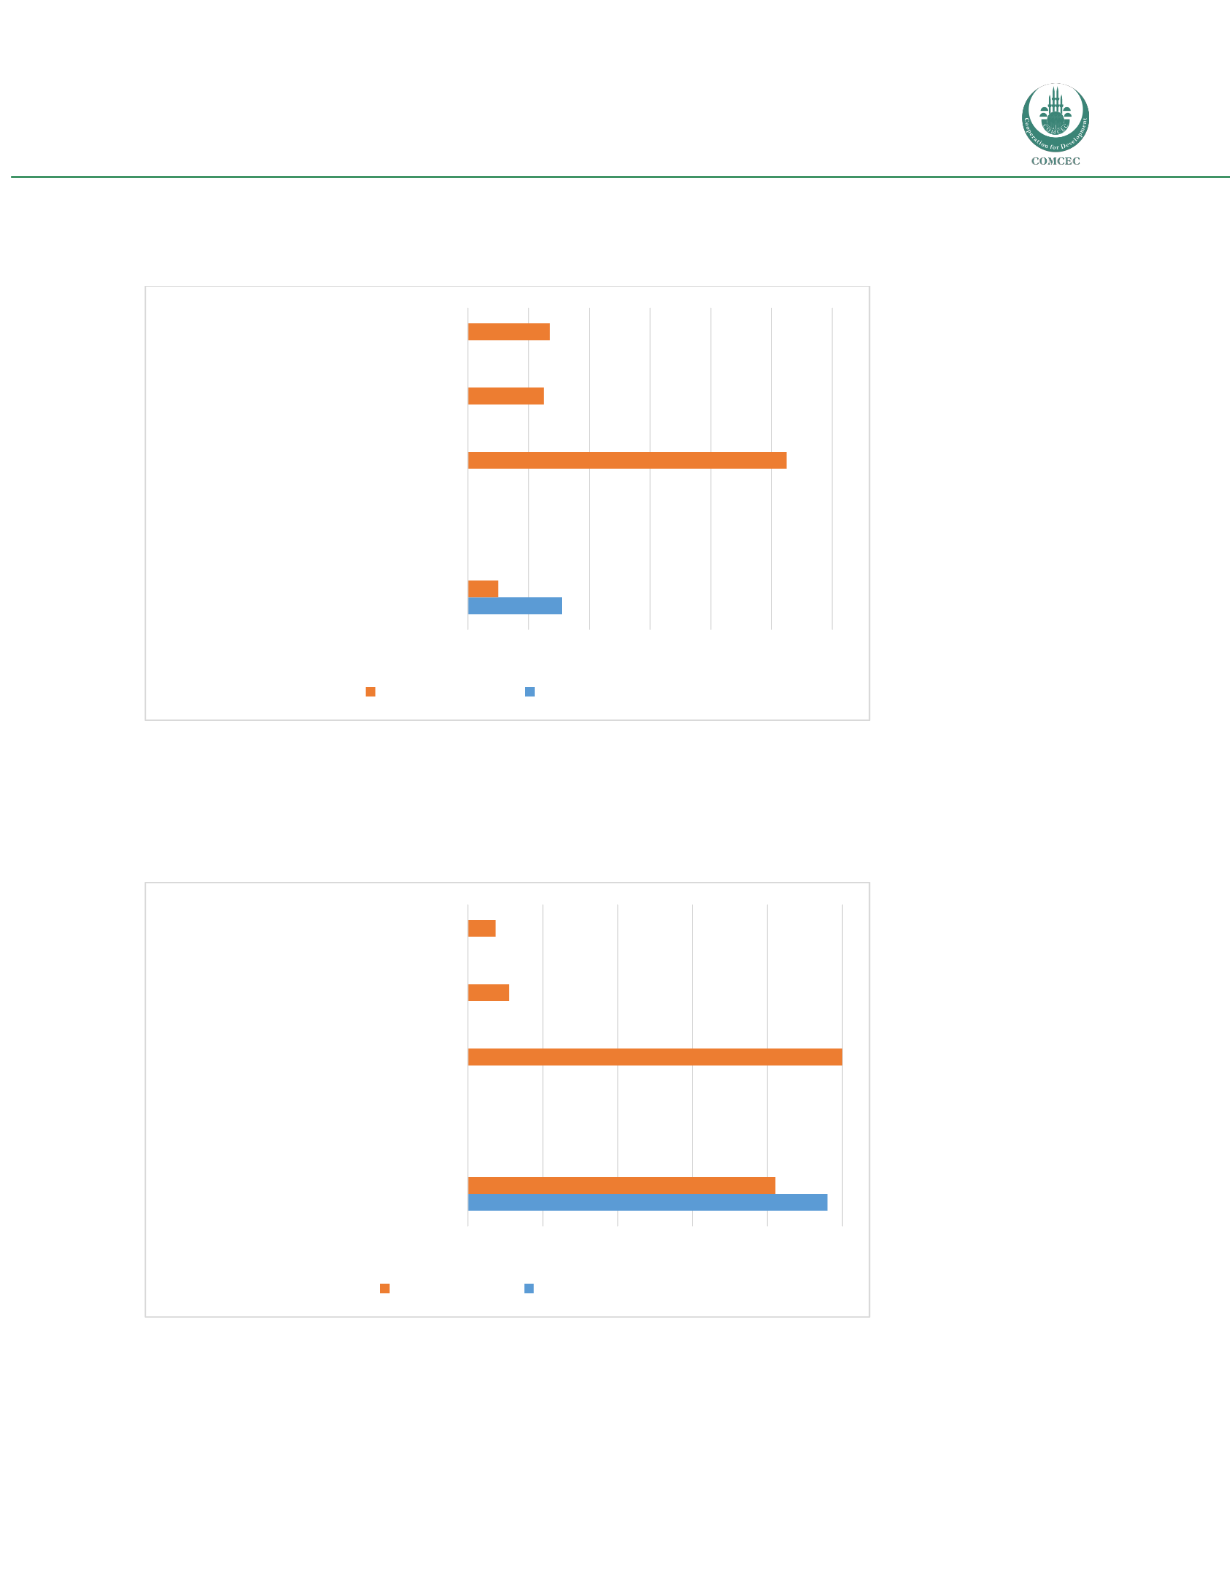
Figure 32: Prevalence of SPS measures and TBTs in Pakistan, five largest value exports of the
Asian group
Source: NTM Map.
Figure 33: Coverage of SPS measures and TBTs in Pakistan, five largest value exports of the Asian
group
Source: NTM Map.
0 20 40 60 80 100 120
Animal and vegetable oils and fats
Mineral fuels and oils
Apparel and clothing
Machinery and mechanical appliances
Electrical machinery and equipment
TBT Prevalence SPS Prevalence
0
0.2
0.4
0.6
0.8
1
Animal and vegetable oils and fats
Mineral fuels and oils
Apparel and clothing
Machinery and mechanical appliances
Electrical machinery and equipment
TBT Coverage SPS Coverage


