
Strengthening the Compliance of the OIC Member States
to International Standards
65
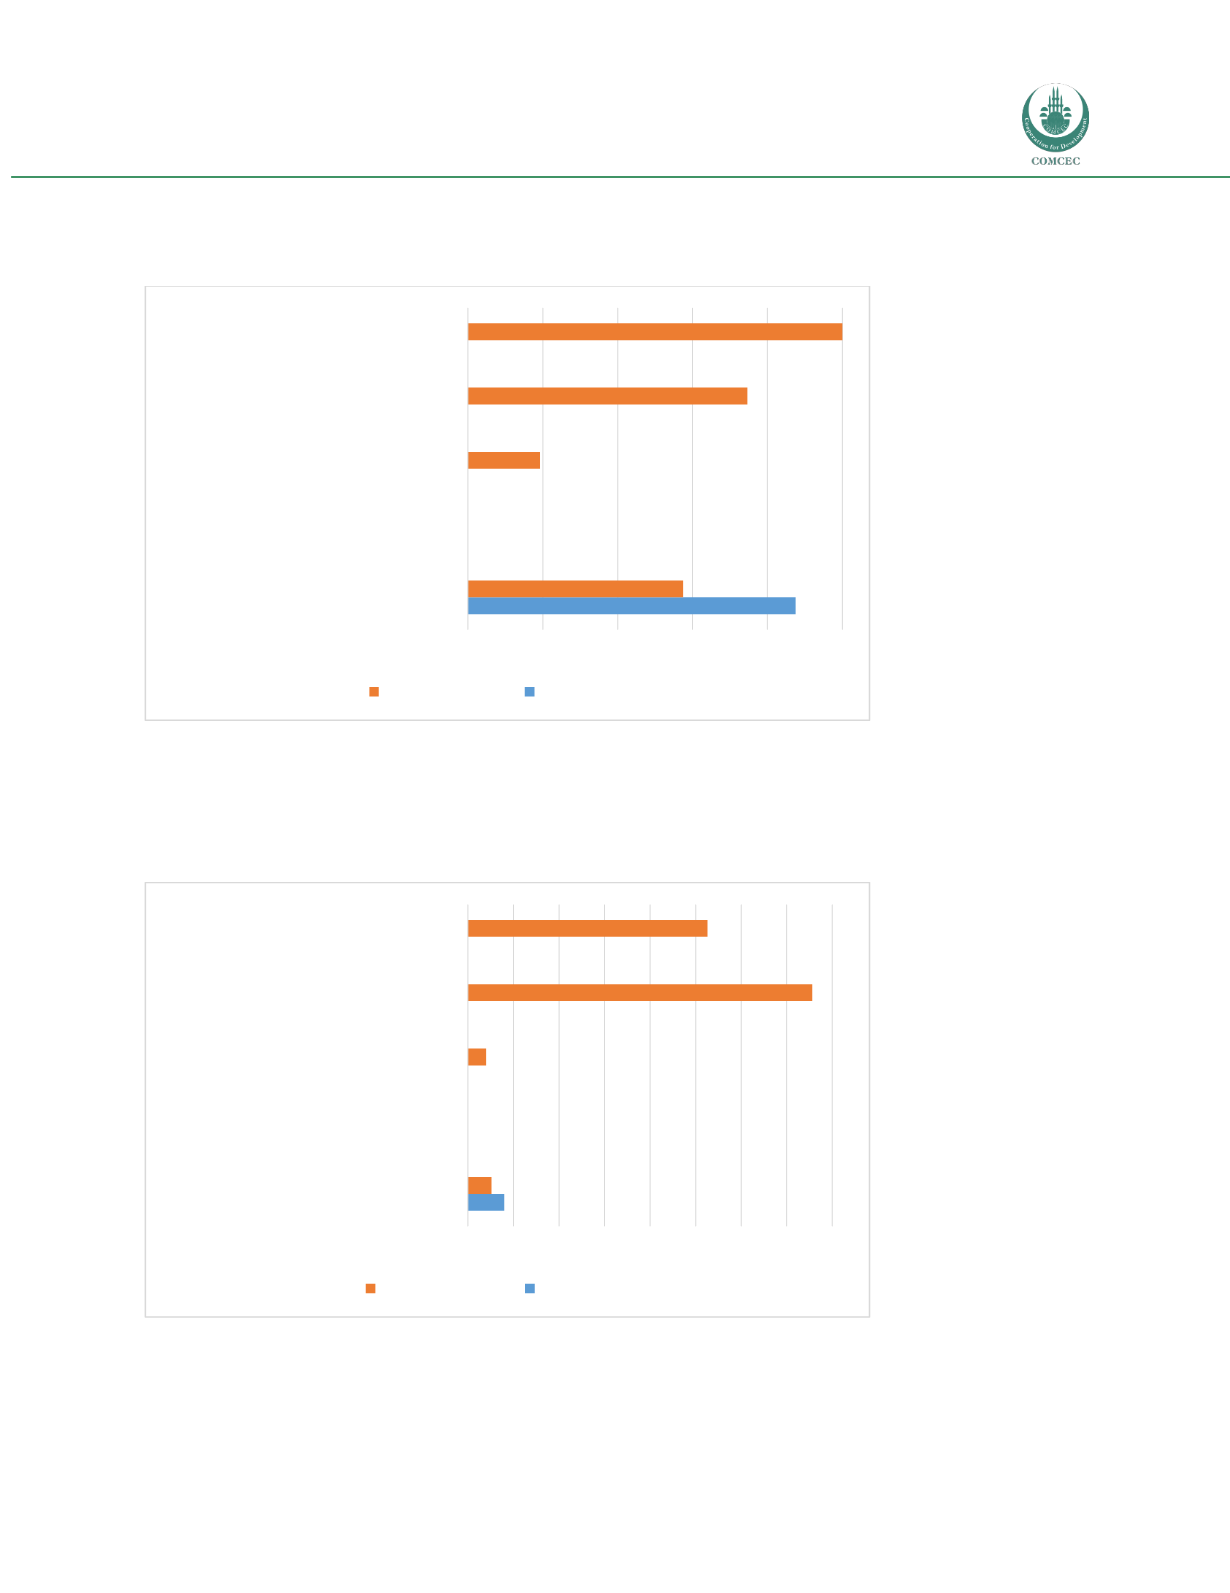
Figure 28: Frequency of SPS measures and TBTs in Nigeria, five largest value exports of the Asian
group
Source: NTM Map.
Figure 29: Prevalence of SPS measures and TBTs in Nigeria, five largest value exports of the Asian
group
Source: NTM Map.
0
0.2
0.4
0.6
0.8
1
Animal and vegetable oils and fats
Mineral fuels and oils
Apparel and clothing
Machinery and mechanical appliances
Electrical machinery and equipment
TBT Frequency SPS Frequency
0 50 100 150 200 250 300 350 400
Animal and vegetable oils and fats
Mineral fuels and oils
Apparel and clothing
Machinery and mechanical appliances
Electrical machinery and equipment
TBT Prevalence SPS Prevalence


