
44
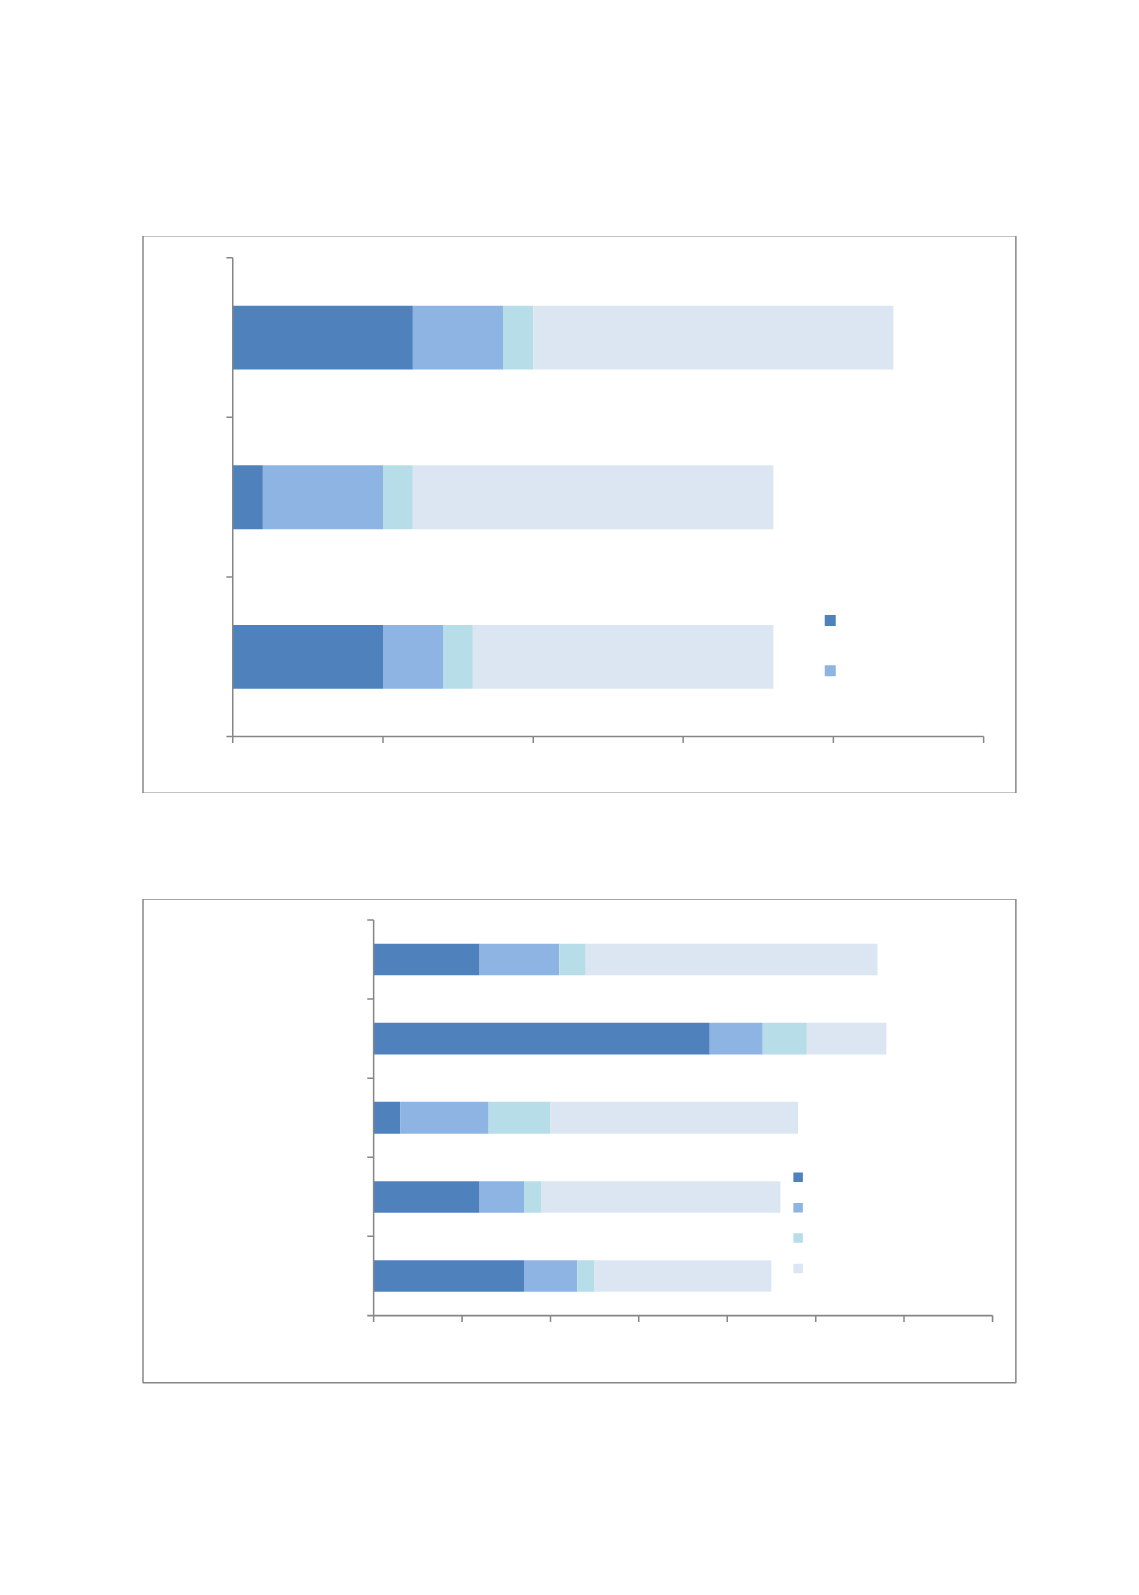
Figure 3.3. Regional distribution of AEO Programs among the OIC Countries
Source: Authors’ compilation using WCO (2018) data.
Figure 3.4. Regional distribution of AEO Programs in the World
Source: Authors’ compilation using WCO (2018) data.
5
1
6
2
4
3
1
1
1
10
12
12
0
5
10
15
20
25
Asian
African
Arab
Operational AEO
Operational CCP
17
12
3
38
12
6
5
10
6
9
2
2
7
5
3
20
27
28
9
33
0
10
20
30
40
50
60
70
Americas and Caribbean
Asia & Pacific
Africa (exc. north)
Europe
OIC
Operational AEO
Operational CCP
AEO under development
no AEO & CCP


