
Facilitating Trade:
Improving Customs Risk Management Systems
In the OIC Member States
171
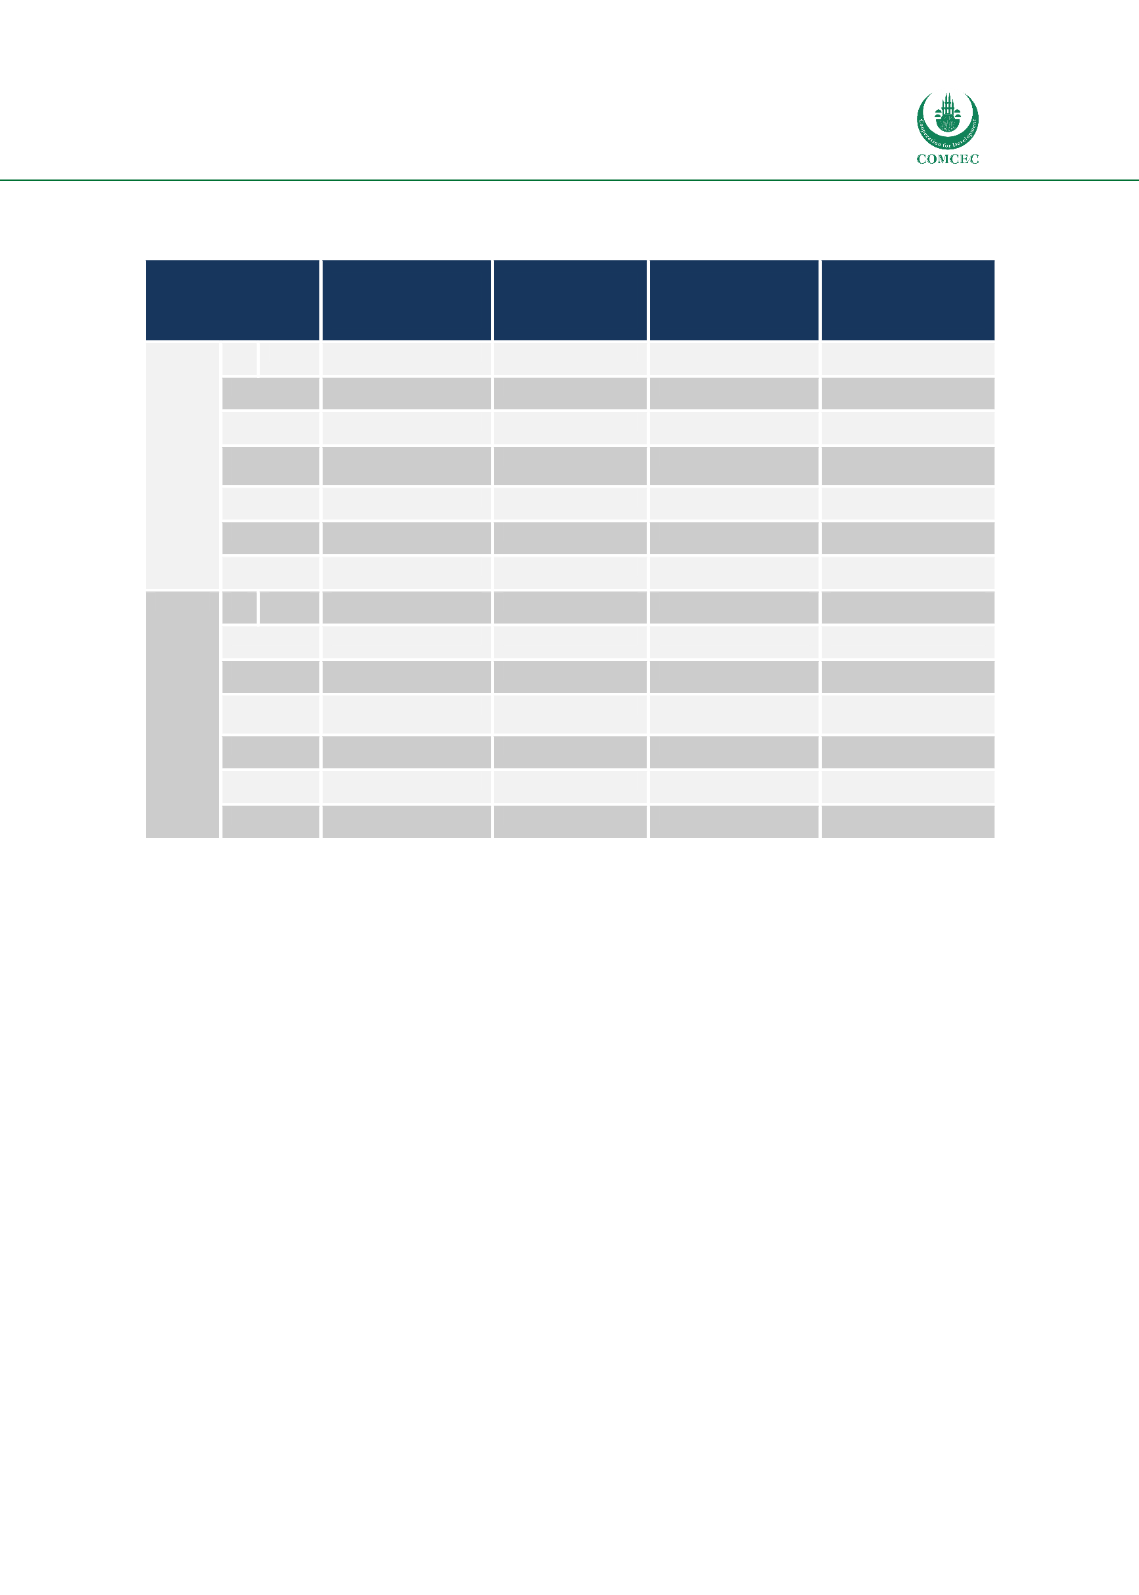
Table 42: Import time and costs in OIC MS related to border and documentary
compliance
Year
Time to import:
Border compliance
(hours)
Cost to import:
Border compliance
(USD)
Time to import:
Documentary
compliance (hours)
Cost to import:
Documentary
compliance (USD)
2016
N
Valid
55
55
55
55
Mean
110
607.04
103.24
302.75
Mode
84
0
a
72
200
Std.
Deviation
70.386
318.99
73.349
235.676
Range
325
1407
330
900
Minimum
2
0
6
0
Maximum
327
1407
336
900
2017
N
Valid
55
55
55
55
Mean
110.13
606.4
102.56
309.11
Mode
84
0
a
72
a
200
Std.
Deviation
72.047
322.827
73.555
249.544
Range
325
1407
318
1000
Minimum
2
0
6
0
Maximum
327
1407
324
1000
Source: Author’s compilation
World Bank changed the Trading across Border Methodology in 2016. Therefore, it is impossible
to include a larger timeframe for analysis.
The data collected under the Trading across Borders newmethodology is not comparable to the
data collected under the old one since Doing Business 2016 published data is significantly
different compared to data published in (and before) Doing Business 2015. Due to
methodological changes, the time is measured in hours and not in days, allowing the data to
reflect the widespread use of electronic data interchanges. Additionally, as opposed to the so-
called ‘old methodology’ the data on domestic transport is no longer taken into consideration
for the calculation of the Distance to Frontier and the ranking for the economy. Similarly, the
exact number of documents needed for exports and imports is no longer taken into
consideration for the calculation of the Distance to Frontier and the ranking for the economy.
For documentary compliance, only the overall time and cost of preparing, submitting and
validating all the documents required by law and commonly done in practice is counted.
For these reasons, it is practically impossible to make a comparative analysis of data between
the old and the new methodology and to determine if there was any impact of the CRM on trade
across borders.
The Figures below are visualizing the trade costs and time for import and export in OIC MS.


