
Special Economic Zones in the OIC Region:
Learning from Experience
121
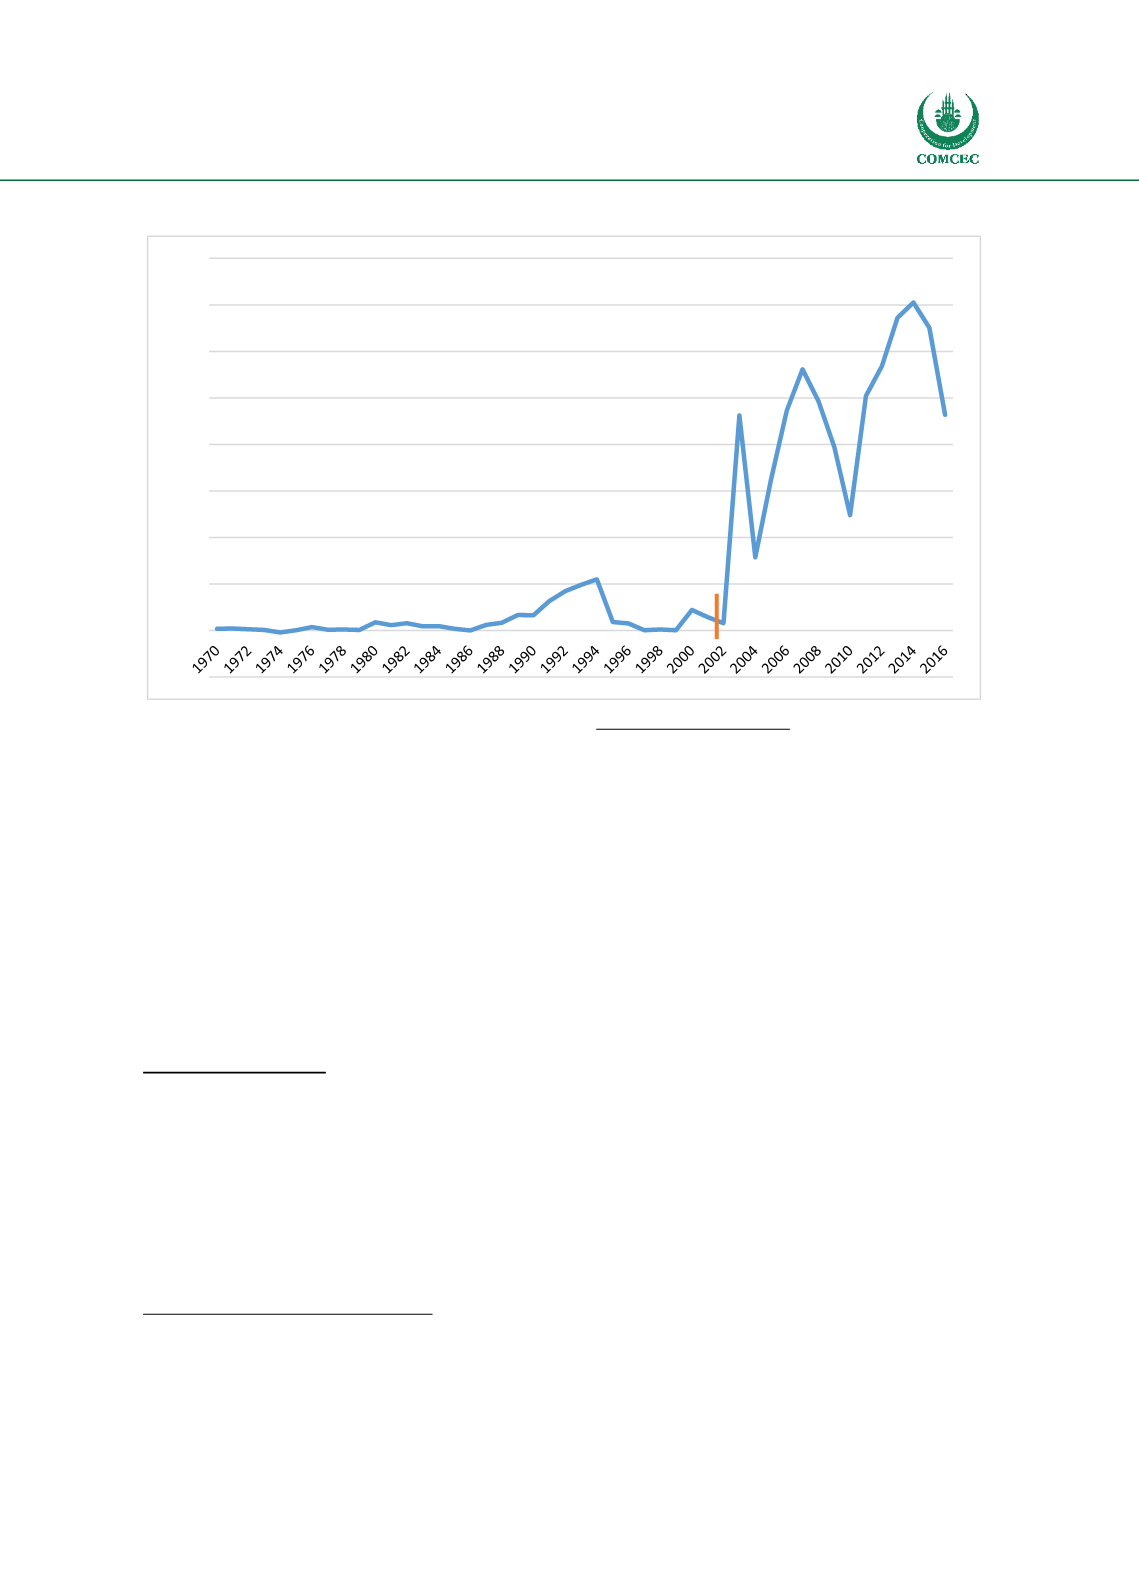
Figure 29 - Morocco Foreign Direct Investment – Net Inflows ($Bn)
Source: World Bank (2017) World Bank Open Data. Available from
: https://data.worldbank.org/The analysis presented above indicates a relationship between export values and FDI in-flows
following the establishment of the Tanger Med zones. Between 2000 and 2008 export values
increased approximately 218% whilst between 2000 and 2016 FDI in-flows increased by
approximately 950%.
105
As outlined in earlier analysis it is recorded that the Tanger Med Zones
account for approximately 25% of total exports in 2016 demonstrating the strength of the
relationship between the export orientated automotive industries located within the Tanger
Med Zones and their contribution to national exports. It has also been estimated that of FDI in-
flows between 2003 and 2016, FDI in Tanger Med Zones accounted for approximately 8% of
total investment.
Skills and Training
Morocco has the appropriate human resources to allow companies to increase competitiveness
and add value to their activities. The country has a very young population, with 64% of
Moroccans being aged under 34. In total there are 40,000 graduates every year (including
10,000 engineers) which provides labour tailored to the needs of companies settling in the
zones.
105
Whilst this analysis has attempted to demonstrate the economic effects of the Tanger Med Zones on the domestic economy
it should be caveated that there may be a number of economic reasons for the performance of the indicators analyzed. A more
detailed econometric analysis would be required to isolate the exact impact of the Tanger Med Zones on the indicators
analysed.
-0.50
0.00
0.50
1.00
1.50
2.00
2.50
3.00
3.50
4.00
Tanger Med FTZ


