


 42 / 194

Reducing Postharvest Losses
In the OIC Member Countries
28
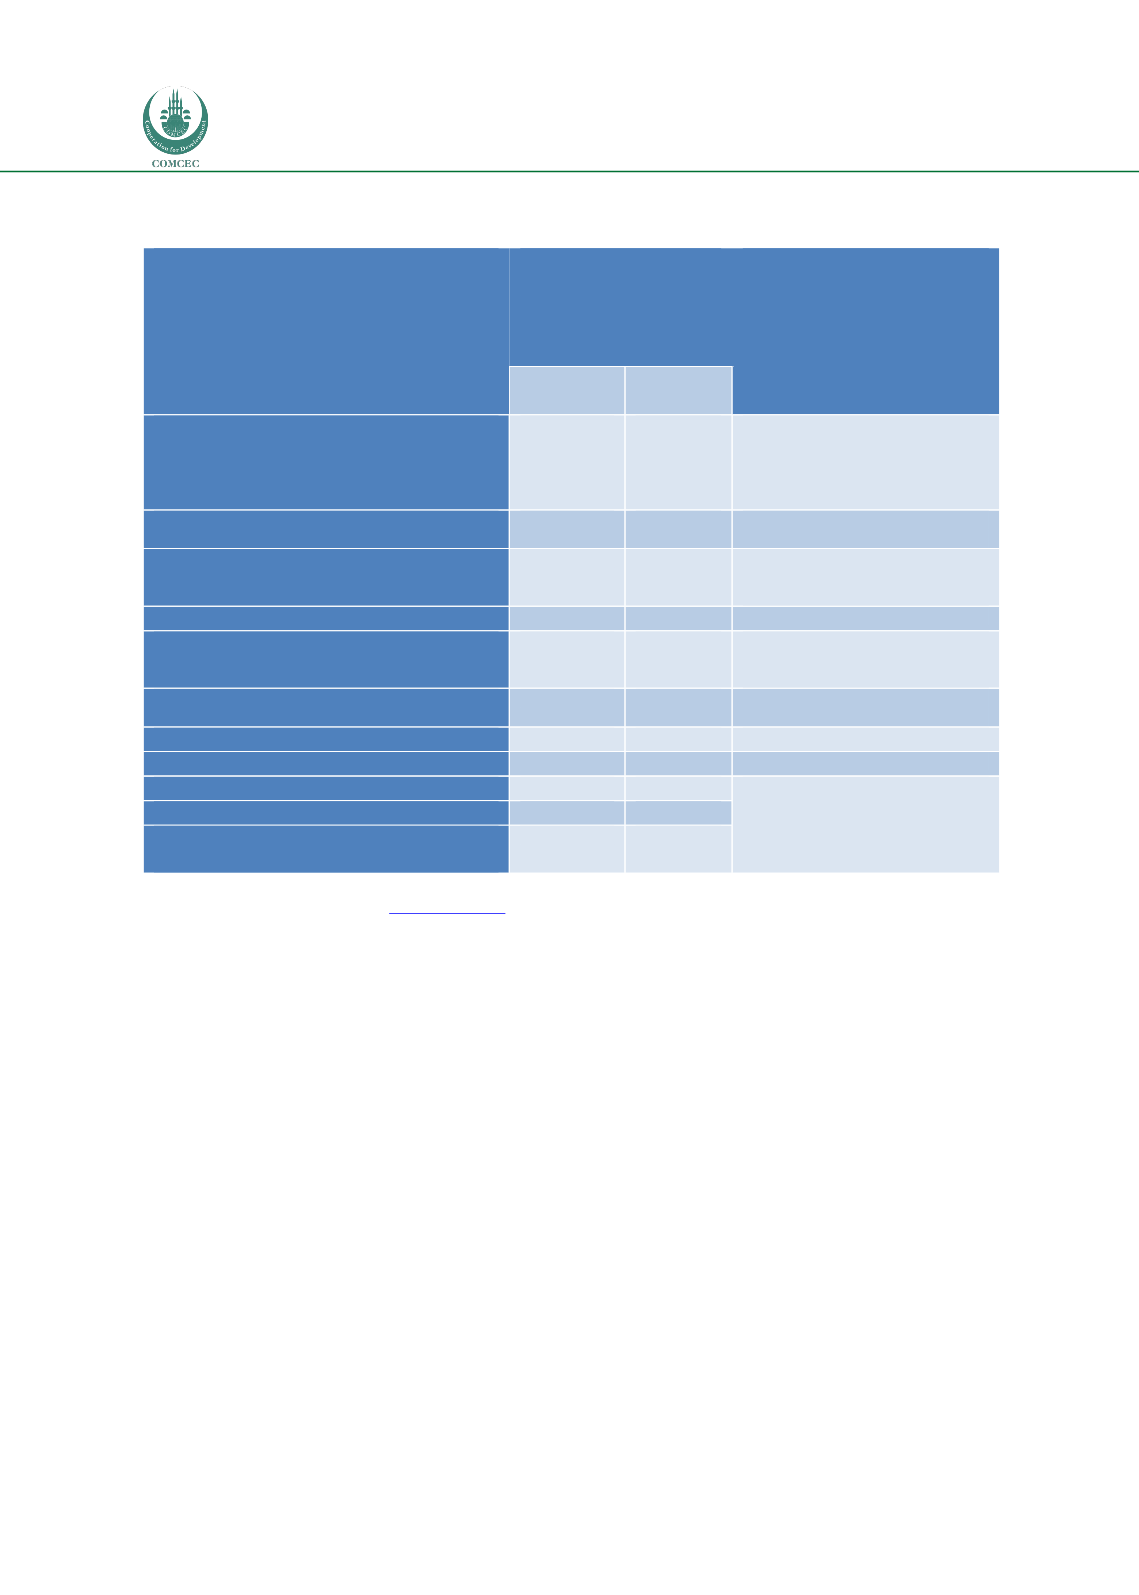
Table 6: Levels of losses along the maize postharvest supply chain in Kaduna state, Nigeria
and Eastern region, Uganda
Postharvest stage
% losses incurred
postharvest by
smallholder maize
farmers storing
maize for 6 months
References used to
determine figures
Nigeria
(2013)*
Uganda
(2012)**
Harvesting/ field drying
6.4
6.4
Egyir et al., 2011; Vervroegen &
Yehwola, 1990; Singano, 2008;
Boxall, 1998; Grolleaud, 1997;
Mvumi et al., 1995; Odogola &
Henrikkson, 1991
Further drying
3.7
4
Odogola & Henrikkson, 1991;
Jonsson & Kashweka 1987
Threshing and shelling
1.2
1.3
Odogola & Henrikkson, 1991
; Egyir
et al
.,
2011;
Boxall,
1998;
Grolleaud, 1997; Mvumi
et al
., 1995
Winnowing
-
-
Transport to farm
2.1
2.4
Odogola, 1991;
Vervroegen &
Yehwola, 1990
; Singano, 2008;
Egyir
et al
., 2011; Boxall, 1998
Farm storage
4.6
10.5
SSEAD, 1997; De Lima, 1979; Giles,
1986; Nyambo, 1993
Transport to market
0
1.7
Odogola, 1991; Egyir
et al
., 2011
Market storage
0
2.7
Egyir
et al
., 2011; Boxall, 1998
Cumulative PHL
18
19.3
% marketed within 3 months of harvest
-
60
Total maize lost in Province that year
(t)
56,900
230,841
Notes: * = Kaduna Province, ** = Eastern Region, “-“ = no data
Source: data taken from APHLI
S www.aphlis.net (2016), illustrations from Hodges & Stathers, (2012).
In Pakistan, a survey in the late 1970s suggested that aggregate PHL were 12.6% in maize
(Chaudhary, 1980).
A recent study in Nigeria focused on the guestimates of PHL for two maize products: green
maize and animal feed, found that farmers reported their biggest losses were due to pre-
harvest pests and diseases, followed by PHL during
harvesting
(estimated at 4.03% of the total
harvest), while shelling, storage of dry maize cobs and dry maize grain and transport of fresh
maize to the market entailed losses of 1.53-2.27% (GIZ, 2013a). Maize marketers’ felt
significant losses occurred during the marketing stages, mostly due to handling and storage
problems (weevils (
Sitophilus zeamais
) (8.5%), rodents (6%), spillage (5.9%), and moisture
(2.5%)), and to a lesser extent during transportation (3.7%). The feed millers reported that
their most significant problems occurred during transportation of the maize from the market
to the feed mill (2%), spoilage during storage of maize grain prior to milling by rodents (2.8%)
and weevils (1%), and during storage of the animal feed product due to weevils after 3 months
storage (2%), spillage of feed (2%), and transport of feed (3%). The study estimated that the
total value of maize (green and grain) and feed lost between harvest and marketing was ~120
billion Naira, which corresponded to approximately EUR 576 million. A small related study,
which used the lifecycle assessment to estimate the environmental impacts of losses calculated
that 1t of maize feed had a footprint of 0.73 t CO
2
eq (GIZ, 2013b). Agriculture was the main
contributor, with maize processing contributing 10% of the footprint. Production of 1t of