


 144 / 169

Increasing the Resilience of the Food Systems
In Islamic States in Face of Future Food Crises
133
among the top 20 producers of major agricultural products, notably producing 80%and 75% of
the world’s jute and palm oil, respectively.
511
The OIC also has a generally young population, which can be one of the key drivers of
socioeconomic development. The share of the population that is between 0 and 24 years old in
OIC countries is 53.49%, which is much greater than the world average (43.70%) and also
exceeds the average of developed countries (28.15%).
512
OIC Challenges
First, despite substantial natural endowments, the OIC has poorly developed agricultural
systems that produce far below their potential. Among the top 50 countries in food availability
(a composite measure of the quality of production and sustainability of food imports ), only
seven OIC countries were identified. Saudi Arabia ranked highest at 35
th
globally, followed by
Kuwait, Egypt, Malaysia, Qatar, Bahrain, and the UAE. Of this group, only Egypt is an agricultural
producer.
513
A major factor limiting the development of agriculture in the OIC is food waste and
mismanagement of agricultural assets, reflective of poor storage and distribution despite the
ability togrow agricultural produce. Foodwaste affects 24%of all food produced globally. In the
OIC, amajor challenge—particularly in LIFDcountries—lies in on-farm losses. Based on a prior
COMCEC study of 30 OIC member states, observable losses on-farm were extensive, exceeding
regional benchmarks and the 24% global benchmark. Fruit and vegetables are particularly
affected, while oilseeds and pulses saw the lowest levels of waste.
514
A particular problem in the
OIC is high levels of aflatoxin, notably in the African countries, which have prohibited the export
and storage of grains.
515
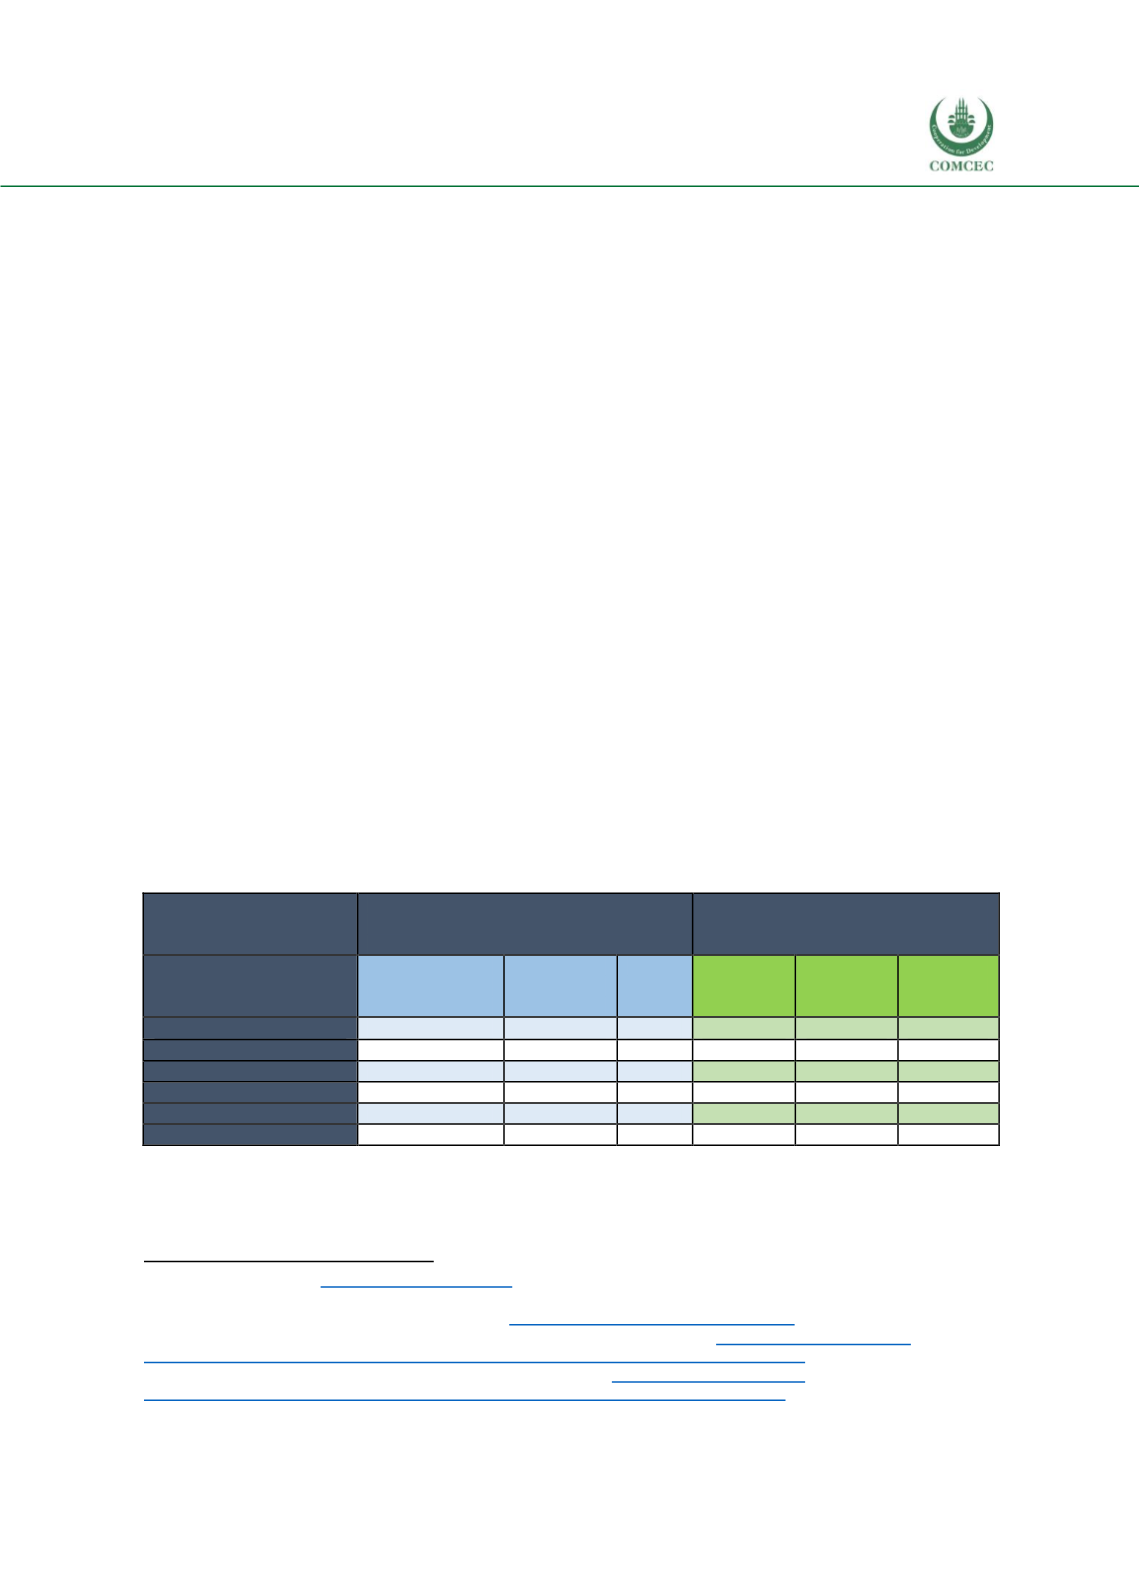
Table 71: Global Losses and Waste Estimates by FAO vs. COMCEC Analytical Study Findings
Global Losses/Waste Estimates
FAO 2009 Data
COMCEC Analytical Study
Findings (2015)
Food Groups
North Africa,
West and Central
Asia
South and
Southeast
Asia
SSA
Arab Group
Asian
Group
African
Group
Cereals
30%
20%
20%
10-30%
10-30%
10-30%
Roots and Tubers
32%
41%
45%
10-30%
10-30%
30-50%
Oilseeds and Pulses
30%
28%
28%
5-10%
5-10%
10-30%
Fruits and Vegetables
52%
52%
55%
30-50%
30-50%
30-50%
Meat and Dairy
23%
20%
20%
10-30%
10-30%
10-30%
Fish and Seafood
30%
33%
32%
5-10%
10-30%
10-30%
Source: FAO and COMCEC
511
OIC-StatComwebsit
e. http://www.oicstatcom.org512
Ibid.
513
Global Food Security Index: Rankings and tren
ds. https://foodsecurityindex.eiu.com/Index514
“ReducingOn-FarmFood Losses in the OIC Member Countries.” COMCEC. 201
6. http://www.sbb.gov.tr/wp- content/uploads/2018/11/Reducing_On-Farm_Food_Losses_in_the_OIC_Member_Countires.pdf515
“Reducing post-harvest losses in OIC countries”, COMCEC, 201
6: http://www.sbb.gov.tr/wp- content/uploads/2018/11/Reducing_Postharvest_Losses_in_the_OIC_Member_Countries.pdf