


 85 / 169

Reducing On-Farm Food Losses
In the OIC Member Countries
71
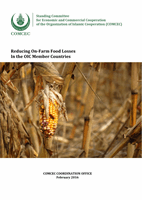
Table 3.11: Compilation Information on Production of Tomatoes in Egypt (Behaira
Governorate in the Nile Delta Area)
Year
Production in
Millions of
Tonnes
Area of
Production in
Hectares
Area
Harvested
in Hectares
Productivity
Tonne/Feddan
Producer
Price
$US/Tonne
2002
6.8
200,000
2006
8.6
2010
7.5
200,000
2011
8.1
212,446
16.0
260.71
2012
8.6
216,395
235.31
2013
8.5
212,946
Source: Source: Beltagy, (2008), Indian Horticulture Database 2011, TINAWY 2010, FAOSTAT, (2011) in Abou-
Shleel and El-Shirbeny, (2014)), FAOSTAT 2013.
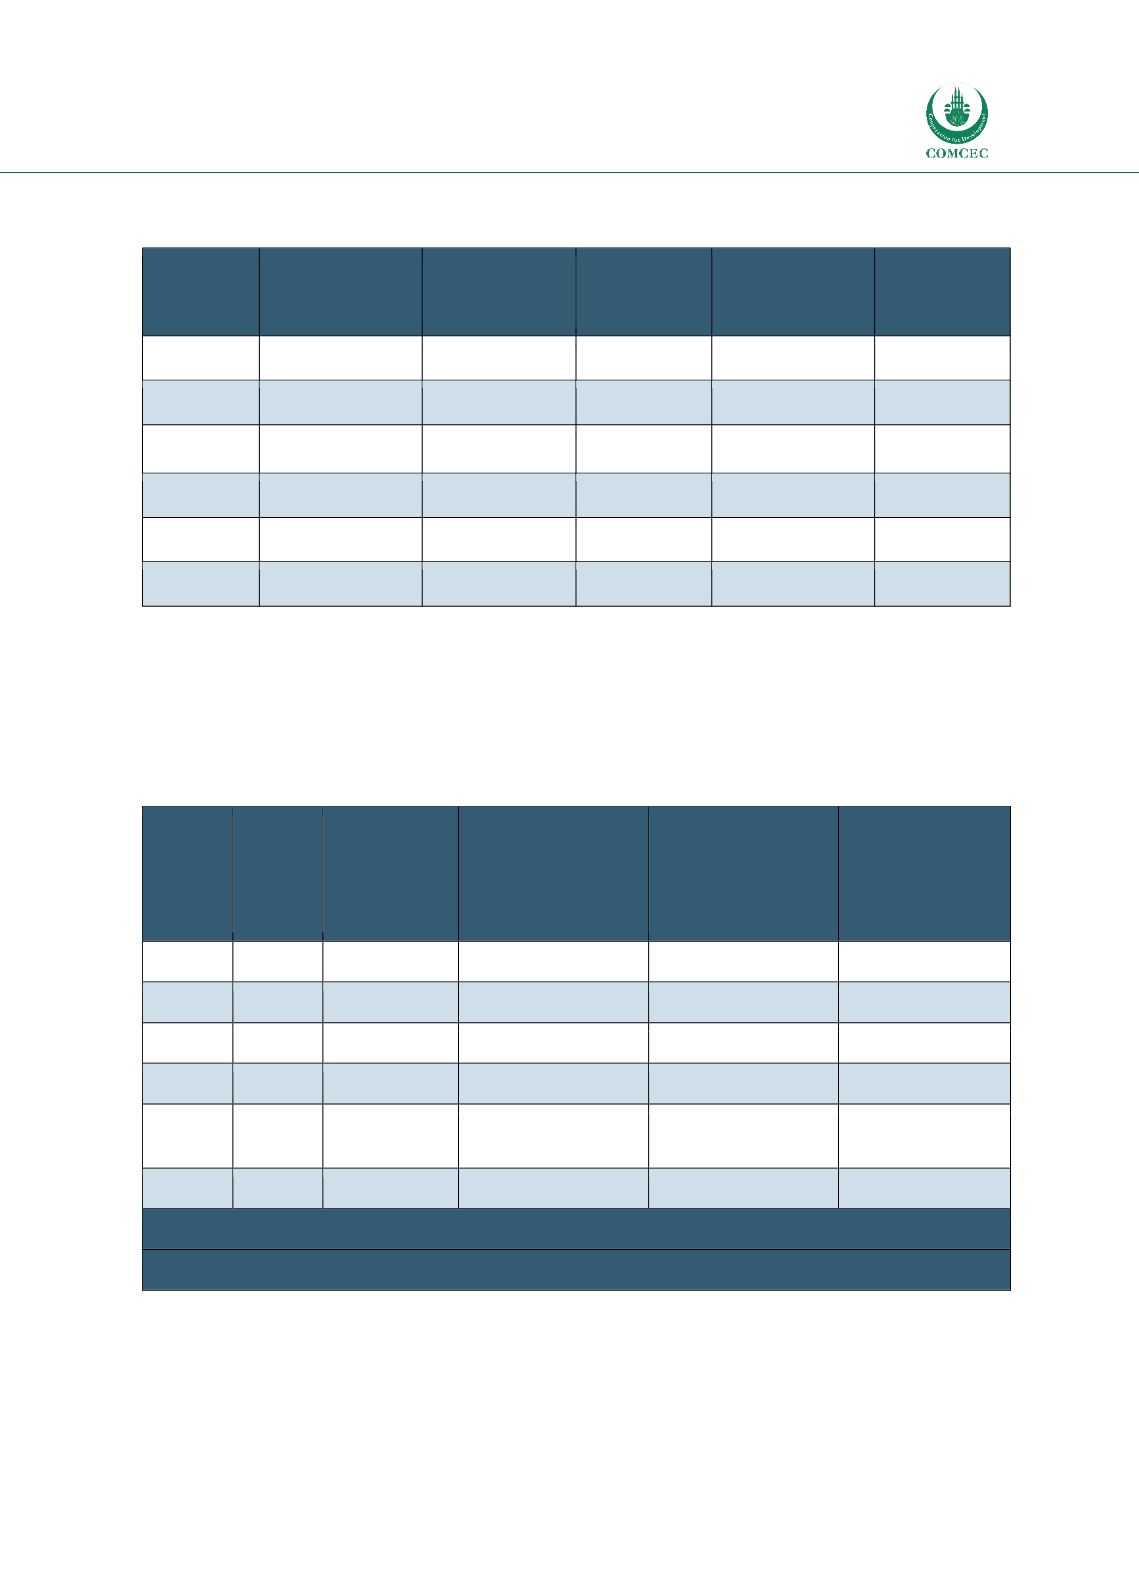
3.5.2. Assessment of On-Farm Losses and Economic Burden
The consultant and field team visited six farms in the Nile Delta region, and their on-farm
assessments in the Behaira Governorate provided the following in Table 3.11.
Table 3.12: On-Farm Assessments at Six Tomato Farms in Egypt
Farm
Farm
Details
Sorted
During
Harvest
Quality Sort by
Consultant
(% with Extreme
Defects or Decay)
Quality Sort by
Consultant
(% with Moderate
Defects or Decay)
Sorted for Size
(%
Discarded by
Trader at Farm
Gate
1
4 ha
0%
35%
45%
2
12 ha
15%
15%
5%
3
12 ha
15%
30%
30%
4
15 ha
15%
20%
10%
5
4 ha
15%
25%
0%
Lost 100% of 2
out of 4 harvests
6
8 ha
30%
20%
45%
Range: 0-30% at harvest; 15-35% at quality sort
Conservative Estimate of On-Farm Losses: 15-20%
Source: Site Visits.
The weather was hot during the harvesting (32-39 °C), and the relative humiditywas low (40%).
Defects and damages were mainly due to yellowing by sunburn and mechanical damage by
workers. Tomatoes are sold by the full crate, always assumed to hold 20 kg, but not weighed by