


 111 / 169

Reducing On-Farm Food Losses
In the OIC Member Countries
97
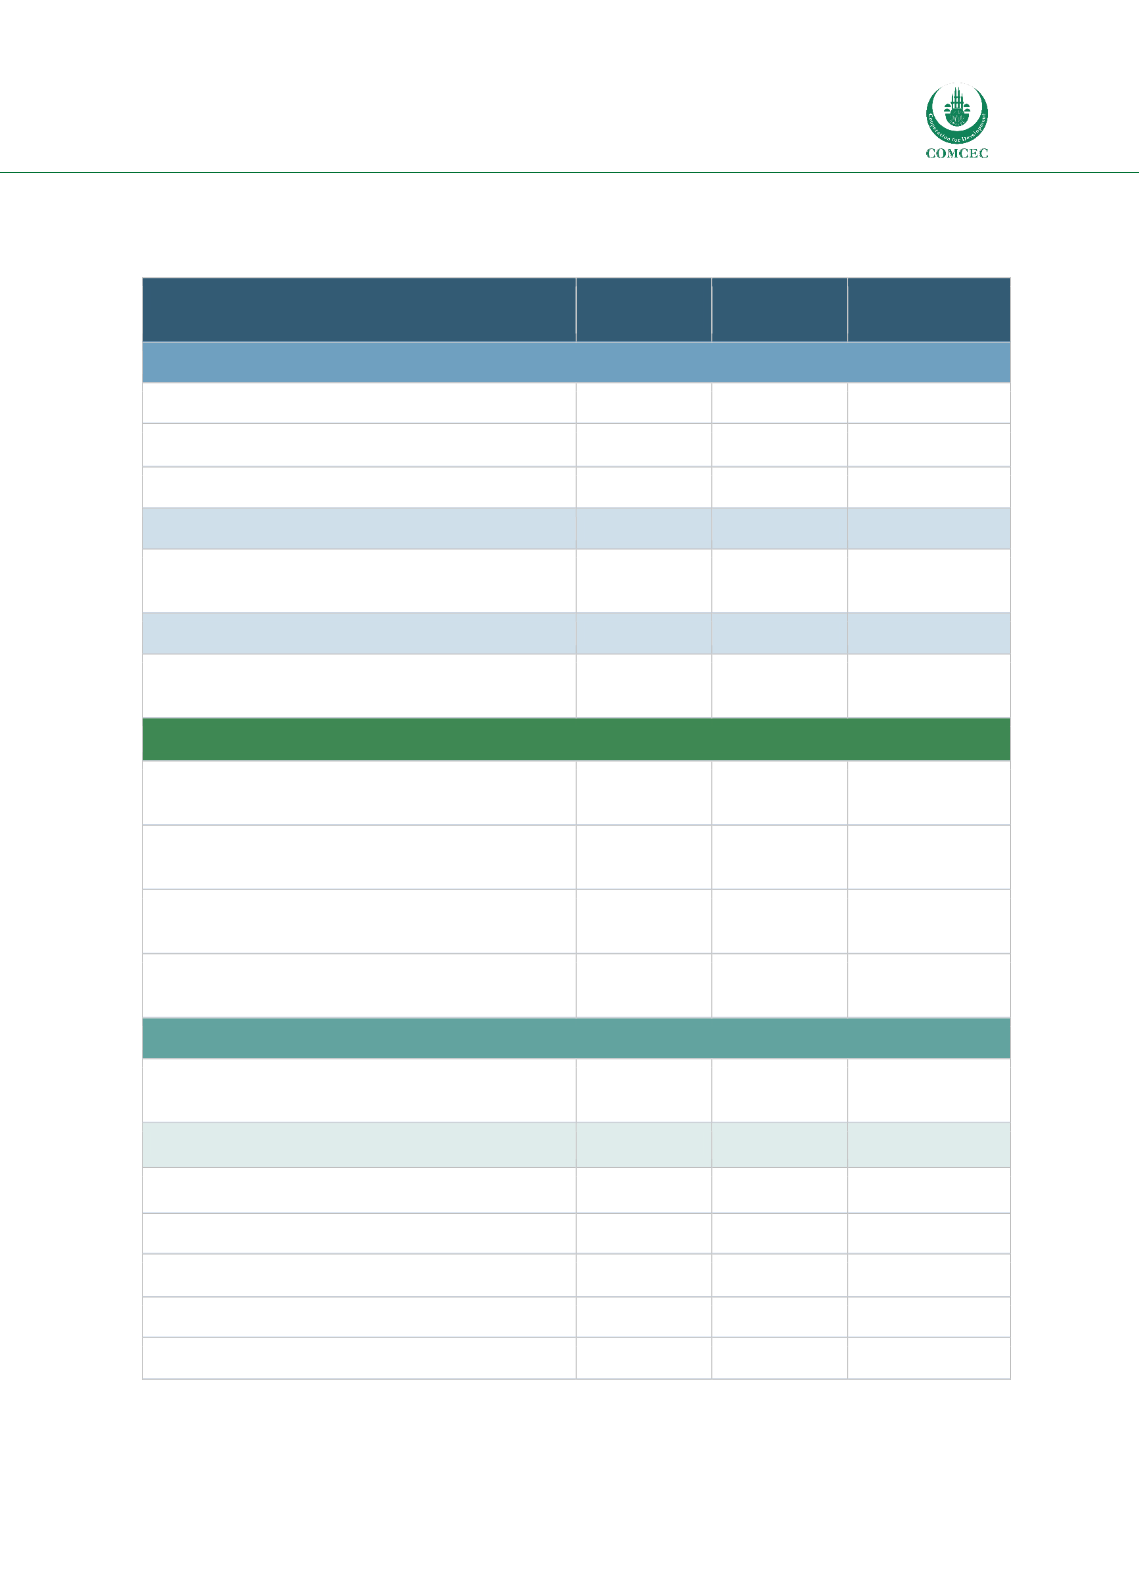
Summary, with the highest ratings and percentages in each table highlighted.
Table 4.2: Tally of Numbers and % of Key Informant Responses for Cereals
Possible Causes of Food Losses for Cereals
Arab Group
N = 17 (%)
Asian Group
N =22 (%)
African Group
N =17 (%)
Pre-Harvest Causes
Poor information and planning
11 (63.70)
15 (68.18)
11 (63.7)
Lack of inputs (fertilizer, etc.)
8 (47.06)
13 (59.09)
10 (58.82)
Poor quality seeds, planting material
9 (52.94)
16 (72.73)
10 (58.82)
Pests on the farm (weeds, insects, rodents)
14 (82.53)
19 (86.36)
14 (82.53)
Poor cultural practices (pruning, fertilizing,
pesticide spraying)
8 (47.06)
14 (63.64)
13 (76.47)
Poor water management or drought
10 (58.82)
16 (72.73)
13 (76.47)
Plant or animal diseases on the farm (fungi,
viruses, bacterial rots)
11 (63.7)
16 (72.73)
10 (58.82)
Harvesting Causes
Poor harvesting practices (incomplete
harvesting)
10 (58.82)
13 (59.09)
9 (52.94)
Wrong time for harvest (immature, over-
mature, improper moisture content)
6 (35.29)
9 (40.9)
6 (35.29)
Mechanical damage during postharvest
threshing and handling (rough handling)
11 (63.7%)
4 (18.18)
10 (58.82)
Poor quality field containers or shipping
packages
10 (58.82)
18 (81.82)
9 (52.94)
Other Causes
Poor temperature management (too cold, too
hot, no cold chain)
10 (58.82)
4 (18.18)
6 (35.29)
Lack of proper storage facilities
11 (63.70)
18 (81.82)
15 (88.24)
Lack of proper food processing and packaging
12 (70.59)
16 (72.73)
8 (47.06)
Delays in transport/distribution
7 (41.18)
9 (40.9)
5 (29.41)
Poor roads and related infrastructure
12 (70.59)
15 (68.18)
8 (47.06)
Lack of marketing options
10 (58.82)
11 (50)
6 (35.29)
Consumption (waste)
8 (47.06)
10 (40.9)
8 (47.06)
Source: Key Informant Surveys.