
Promoting Agricultural Value Chains
In the OIC Member Countries
63
100% exemption of custom payments on importing technological equipment;
100% exemption from custom payments on importing raw materials not produced in Uzbekistan
(synthetic fibre, fabric, etc.);
15% discount from world cotton price;
Special rules to finance the cotton lint purchases by 15% cash payment and remaining 85% payable in 90
days, covered by bank guarantee;
Zero rating VAT (20%) on textile exports;
Up to January 1, 2016, exemption from paying import and customs duties on chemicals, dye-stuff,
accessories and fittings, as well as other auxiliary materials that are imported to the Republic for
production purposes, but are not manufactured domestically.
Source: USDA, 2014b
4.8
Trade costs and policies
Trade costs are influenced by distance and transport costs, tariff and non-tariff measures, and
logistics. Countries tend to use trade policy measures to discourage imports of foreign
products, together with industrial policy measures, in order to spur industrial growth and
economic diversification. Accordingly, support measures for particular sectors, combined with
tariff and/or other trade measures aim to protect them from foreign competition on the
domestic market and boost their export performance at the same time. Such trade policies
affect economic activity and well-being not only in the country enacting these policies but in
their partner countries as well.
A study undertaken by the Statistical, Economic and Social Research and Training Centre for
Islamic Countries (SESRIC) in 2014 found that trade costs in OIC countries are higher than in
developed and other developing countries. Trade costs among OIC Member Countries are
lower than trade costs between OIC and other developing countries, but significantly higher
than trade costs between OIC and developed countries (SESRIC, 2014).
On average, in developed countries trade costs fell about 20 percent between 1995 and 2010.
In OIC Member Countries trade costs only decreased 9 percent in the same period. OIC
Member Countries are, in general, more protectionist when compared to other countries.
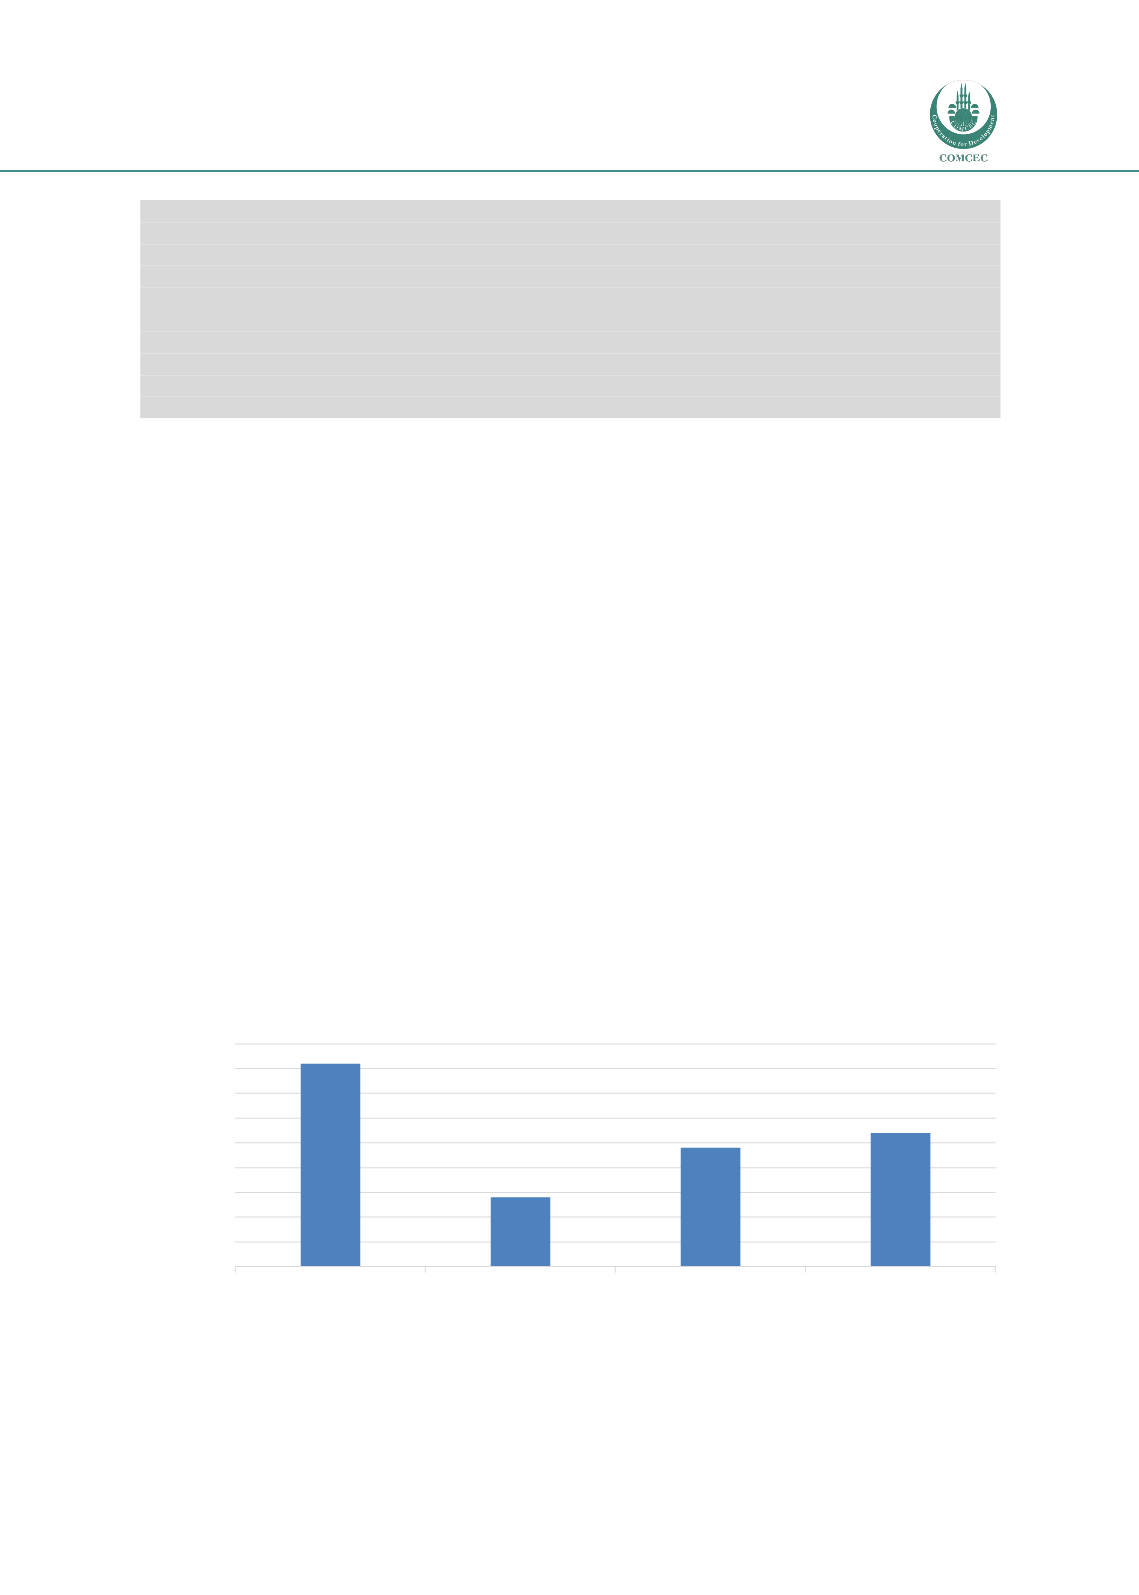
Figure 4-5below shows the OIC Member Countries tend to have higher tariff rates for
agricultural products than others:
Figure 4-5 Average tariff rates for agricultural products
Source: World Tariff Profiles, WTO/ITC/UNCTAD, 2014
12.5
13
13.5
14
14.5
15
15.5
16
16.5
17
OIC average
Other developing
World average
Developed
Percentage


