


 33 / 142

Promoting Agricultural Value Chains:
In the OIC Member Countries
24
and sales, particularly for branded manufacturers and retailers. Some of the largest companies
(e.g. Nestlé, Coca-Cola) and global brands (e.g. Nike) suffered significant losses and
reputational damage as a result of activist campaigns blaming the companies for inadequate
working conditions and environmental degradation in their supply chains. Many companies
have since sought to protect their business by engaging in CSR activities, i.e. activities which
address “the responsibility of enterprises for their impacts on society” (definition of CSR by the
European Commission, 2011). This includes the adoption of corporate codes of conduct,
sustainability reporting and stakeholder engagement. While the CSR trend initially focused on
large multinational companies from industrialised countries which could easily be targeted in
advocacy campaigns, companies from emerging markets are increasingly catching up. For
instance, with regard to sustainability reporting, a recent survey confirms exceptional growth
in emerging economies. Companies from many of these countries are now approximately on
par with companies from the European Union (KPMG International, 2013b).
The most dominant manifestation of the increased importance of CSR is the growing
proliferation of sustainability standards, as already referred to in Section 2.1.4. Growth since
the late 2000s has expanded far beyond the niche markets of the early 1980s, 1990s and early
2000s. By now sustainability standards have penetrated the mainstream markets for a variety
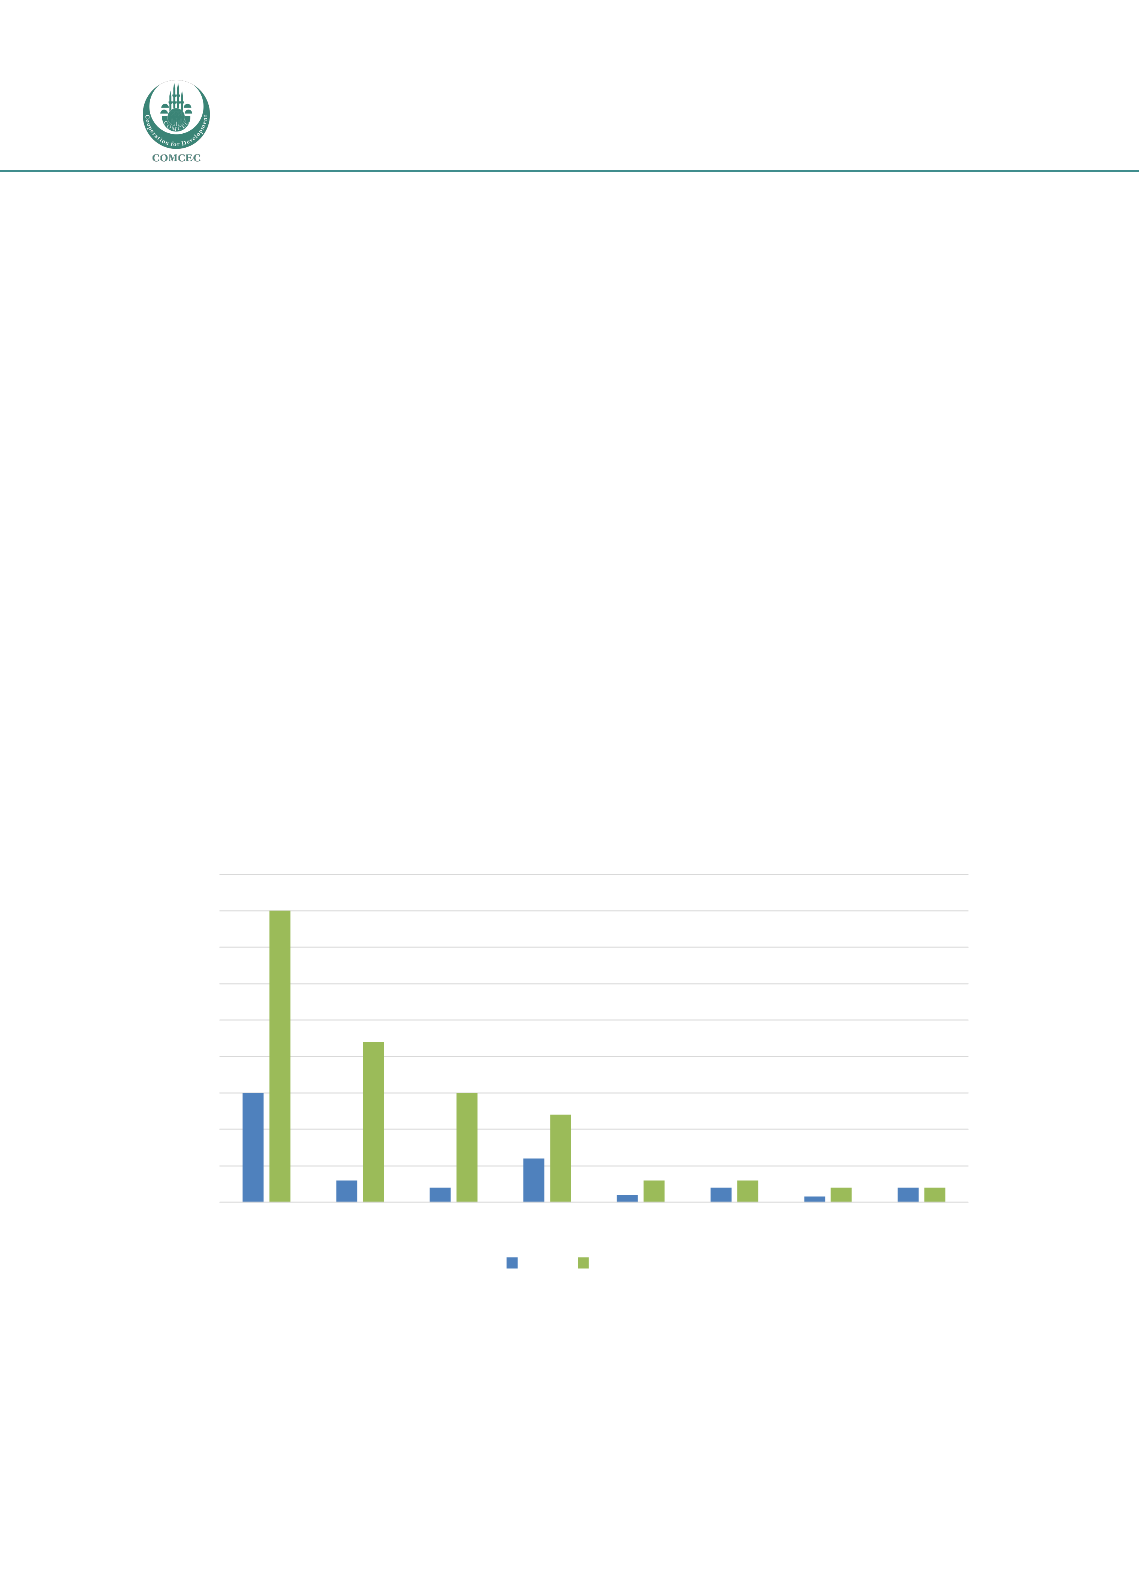
of agricultural products according to a recent survey: For instance, sustainability standard-
compliant coffee, which led in terms of market penetration, reached a 40 percent share of
global production in 2012 (up from 15 percent in 2008) (Potts et al., 2014). Other agricultural
products also experienced a rise in market shares (in terms of global production) (see
Figure 2-2).
Figure 2-2 Market shares of selected sustainability standard-compliant agricultural
products
Source: Potts et al., 2014
0
5
10
15
20
25
30
35
40
45
Coffee Cocoa Palm Oil
Tea
Cotton Bananas Sugar Soy Beans
Percentage
2008 2012