
Improving Institutional Capacity:
Strengthening Farmer Organizations in the OIC Member Countries
54
focus on the Social Solidarity Economy method that is based on the principles of
shared access to knowledge, market information and resources
Membership
profile
KPA has 197 organizations, 120 of whom are producer organizations and 77 of whom are
NGOs. To become a member, an organization must have a local, regional or sub-regional
presence, with a minimum of 500 members working in agriculture, agrarian reform or
business services geared towards farmers and farming communities. Most members are
the organizations that represent local Indonesian farmers, with an average household
farm size of 0.5 hectares
Business
model
Registered as a civil society organization in Indonesia. Funding primarily comes from
membership fees (at USD 1 per member), donor funding (from the Ford Foundation,
Oxfam and the International Land Coalition), loans, and in-kind provision of paralegal and
legal services underwritten by the State
Performance of the KPA
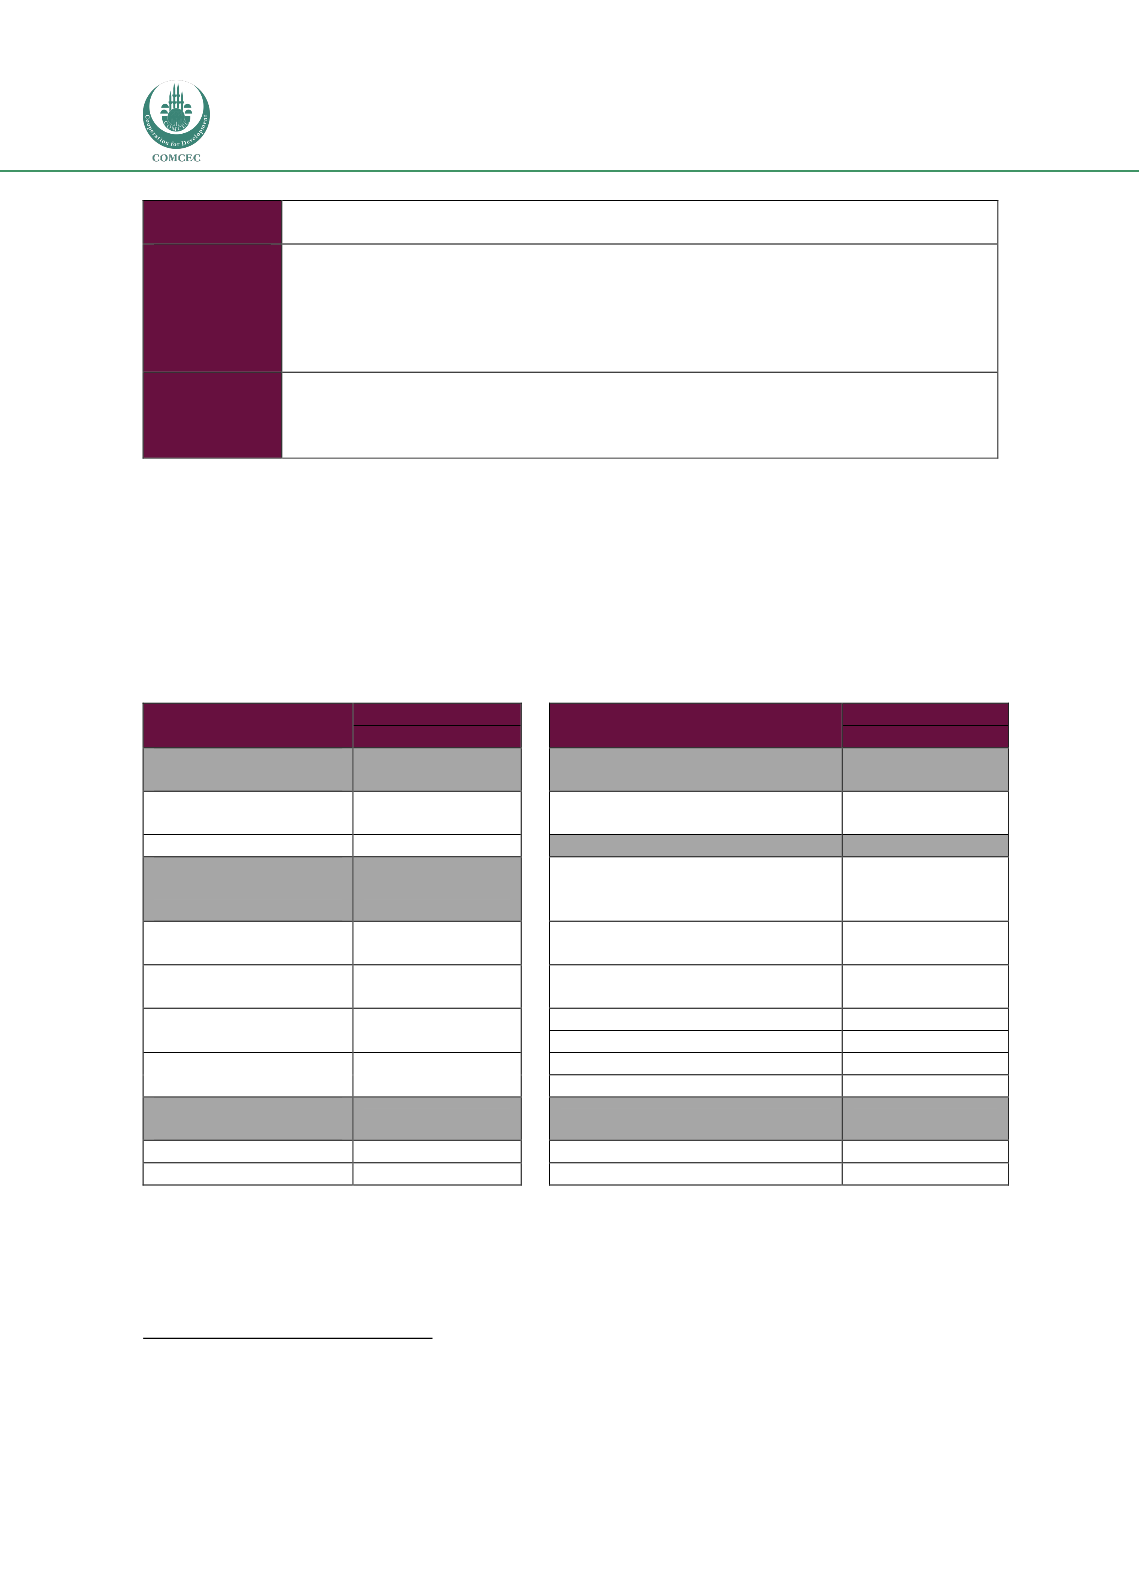
Below, the KPA’s is performance is assessed across two main areas: organizational setup and
impact capacity using the Farmer Organization Scoring Tool. Scores are given out of 1.0, and
category scores are a weighted average of the component scores (where weights are based on
the total number of points in each category). The KPA performed well in the
technical
assistance and other services
, and in
business fundamentals
, and performed less well in
terms of
economic gains.
Table 18: Performance of the KPA in key dimensions
79
Organizational Setup
(68 points)
Aggregate Score
Impact capacity
(51 points)
Aggregate score
0.63
0.43
Governance (27
points)
0.44
Strategic Potential (6 points)
0.67
Organizational
structure
0.53
Overall Strategy
0.67
General Assembly
0.33
TA and Other Services (41 pts)
0.49
Business
Fundamentals (27
points)
0.67
Market Access
0.69
Financial Planning and
Management
0.67
Access to Inputs, Equipment, &
Infrastructure
0
Resource & Revenue
Generation
0.38
Transportation and Storage
0
Human Resource
Management
1.00
Financial Services
0.50
Meeting Member Needs
0.50
Systems and
Infrastructures
1.00
Advisory and Knowledge Services
1.00
Advocacy, Policy & Collaboration
1.00
Representation (14
points)
0.93
Economic Gains (4 points)
0
Accountability
0.93
Productivity
0
Quality & Value Addition
0
79
This table is calculated based on the answers to and scoring system of the Profiling Tool shown in Annex 2, as given to the
authors by SPI leadership during an in-country visit to Indonesia in October 2014.


