


 231 / 235

Facilitating Smallholder Farmers’ Market Access
In the OIC Member Countries
199
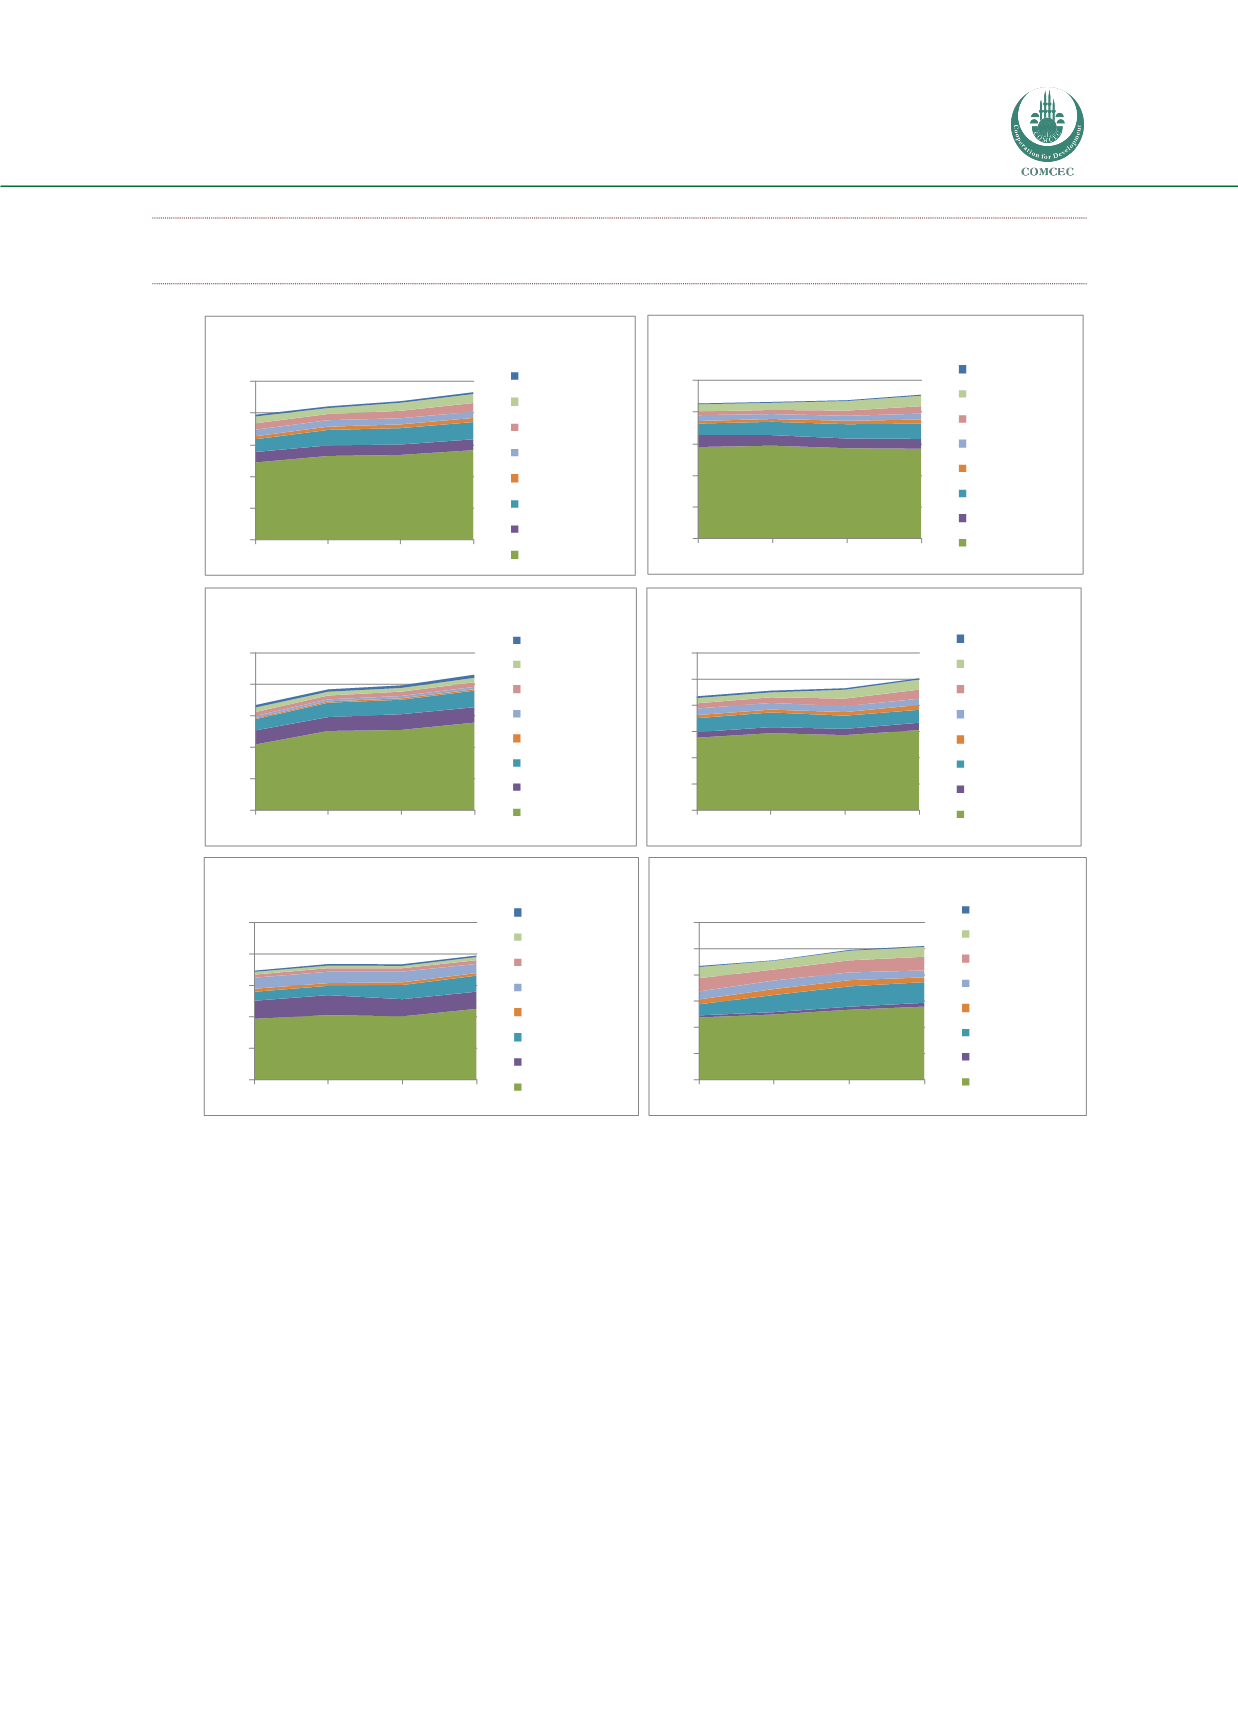
FIGURE 1.5 FOOD BALANCE AVERAGES: FOOD SUPPLY
(KCAL/CAPITA/DAY)
Source: FAOSTAT, FISHSTAT
0
500
1000
1500
2000
2500
1980
1990
2000
2009
Transition (T1) countries, Average Food Supply
(kcal/capita/day)
Fish and Seafood
Milk
Meat
Fruits
Vegetables
Vegetable Oils
Starchy Roots
Cereals
0
500
1000
1500
2000
2500
1980
1990
2000
2009
Transition (T2) countries, Average Food Supply
(kcal/capita/day)
Fish and Seafood
Milk
Meat
Fruits
Vegetables
Vegetable Oils
Starchy Roots
Cereals
0
500
1000
1500
2000
2500
3000
1980
1990
2000
2009
Urbanizingcountries, Average Food Supply
(kcal/capita/day)
Fish and Seafood
Milk
Meat
Fruits
Vegetables
Vegetable Oils
Starchy Roots
Cereals
0
500
1000
1500
2000
2500
3000
1980
1990
2000
2009
Urban countries,Average Food Supply
(kcal/capita/day)
Fish and Seafood
Milk
Meat
Fruits
Vegetables
Vegetable Oils
Starchy Roots
Cereals
0
500
1000
1500
2000
2500
1980
1990
2000
2009
Agriculture based countries, Average Food Supply
(kcal/capita/day)
Fish and Seafood
Milk
Meat
Fruits
Vegetables
Vegetable Oils
Starchy Roots
Cereals
0
500
1000
1500
2000
2500
1980
1990
2000
2009
COMCEC(all) countries, Average FoodSupply
(kcal/capita/day)
Fish and Seafood
Milk
Meat
Fruits
Vegetables
Vegetable Oils
Starchy Roots
Cereals