


 60 / 206

Improving Agricultural Statistics in the COMCEC Region
48
CountrySTAT. A possibility here would be to incorporate a variable on the rates of response to
FAO questionnaires or ratios of official data in FAOSTAT. The problem with this possibility is
that the questionnaire return analysis done by FAO for AFCAS and APCAS do not permit the
construction of a complete and consistent list for COMCEM member countries. Additionally,
the analysis of source flags in FAOSTAT, which shows whether or not the data is official, are
not available for resource statistics.
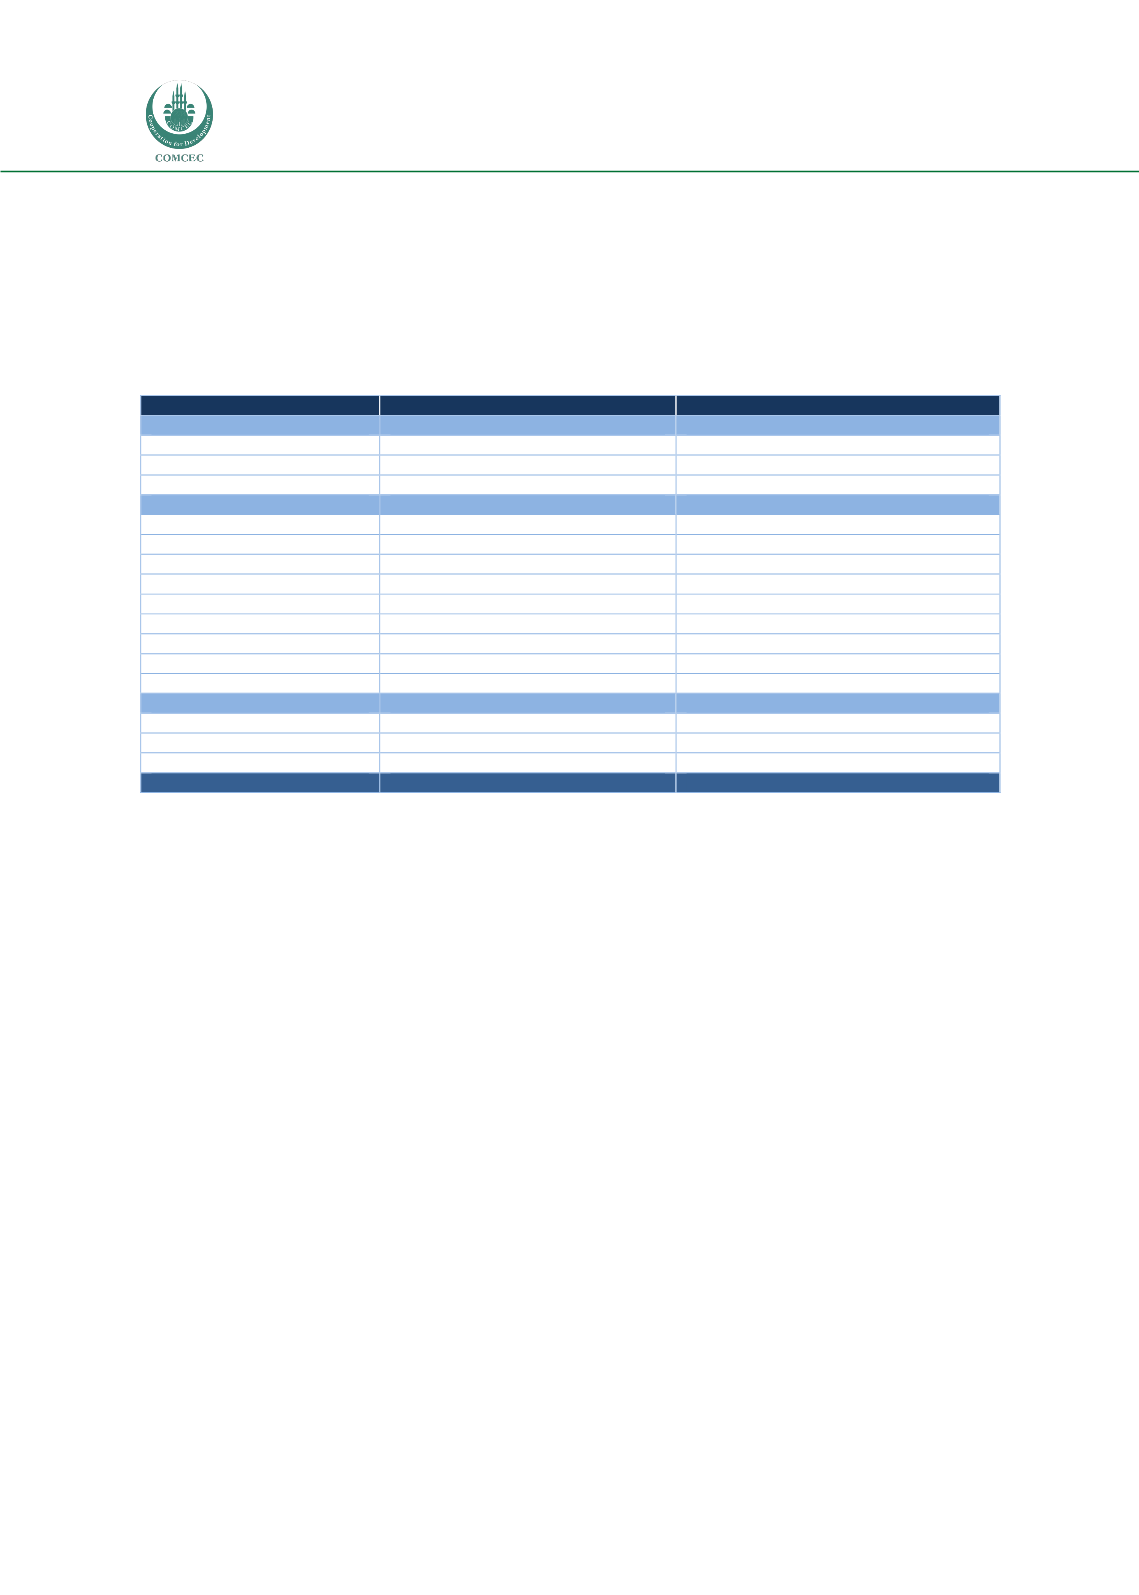
Table 35: Availability Indicators, Variables and Scores
Indicator
Variable
Score
Dissemination Format
19
Free Web
12 (1.2 per Statistics Group)
Free CD
6 (0.6 per Statistics Group)
Free Hardcopy
3 (0.3 per Statistics Group)
Web Based Database
26
Language
1.3
Ease of Access
1.3
Timeliness
3.9
Data Richness
2.6
Metadata
2.6
Agricultural Census
2.6
Online Inquiry/Request
1.3
Online Search
5.2
Coverage
5.2
CountrySTAT Partnership
15
Active Member
15
Limited Activity Member
10
No Activity Member
5
Total Availability
62
b.
The Index of Agricultural Statistics Development Results
The computed IASD is presented for the 36 COMCEC Member Countries in Table 36. The
average score for these countries is 110, which is slightly more than 50 percent of the
maximum possible score of 200. The African group’s score is higher than the other two groups
and the COMCEC average. The Asian group’s average score is slightly lower than the average
COMCEC score. The Arab group’s average score is the lowest. Figure 4 presents the ordered
index numbers for the individual countries together with the group and COMCEC averages.
Following observations can be made:
Turkey has by far the highest index score, followed by Burkina Faso, Mozambique and
Morocco. Côte d’Ivoire, Sudan, Kuwait, Senegal and United Arab Emirates are at the
bottom of the scale.
In the African group, the best performers are Burkina Faso, Mozambique and Togo,
and the worst are Côte d’Ivoire, Senegal and Guinea-Bissau (Figure 5).
In the Arab group, the best performers are Morocco, Egypt, Tunisia and Iraq, while the
worst are Sudan, Kuwait and United Arab Emirates (Figure 6).
In the Asian group the best performers are Turkey, Iran and Bangladesh, and the worst
are Afghanistan, Kyrgyzstan, and Malaysia (Figure 7).