
Improving Agricultural Market Performance:
Developing Agricultural Market Information Systems
27
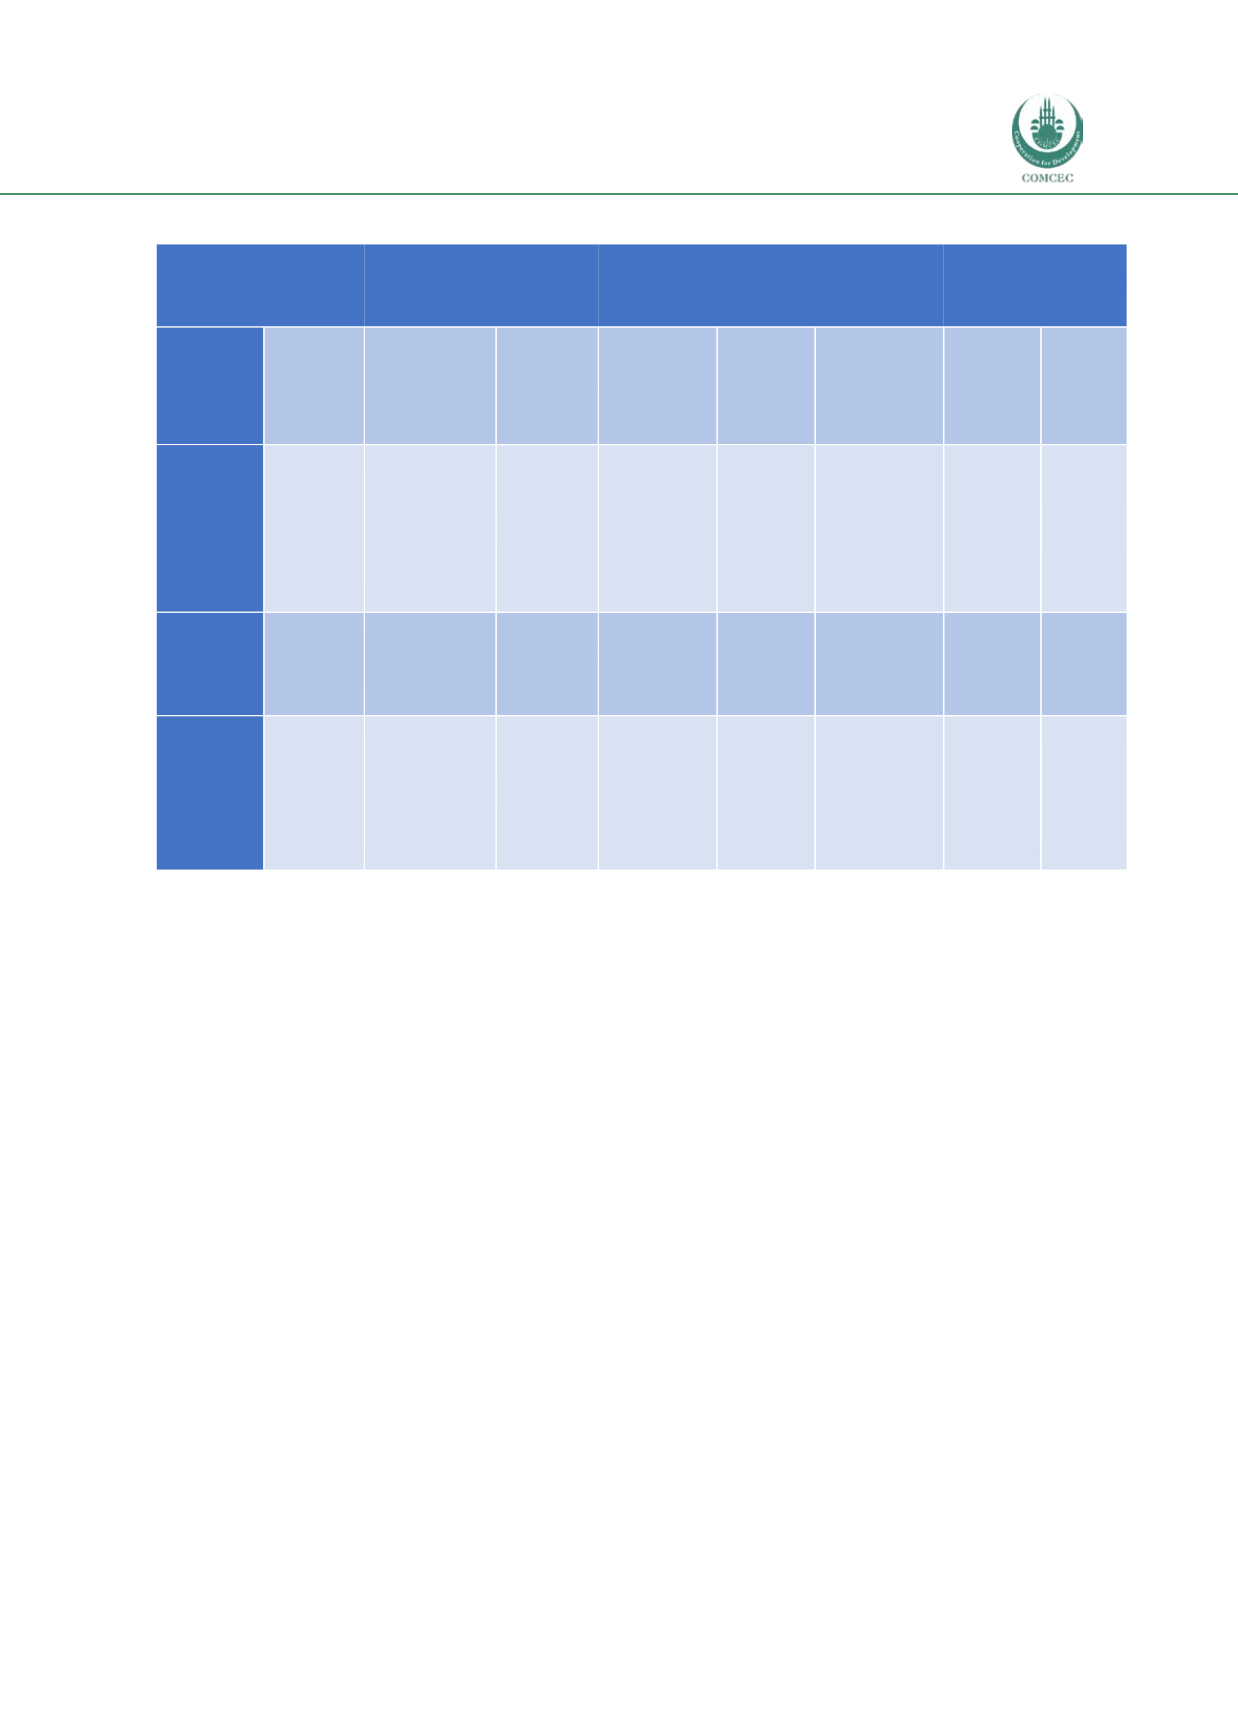
Table 1: Typologies of Second Generation (2GMIS) Models
Type of provider
Product
coverage
Area covered
Institutional
home
Data collection
Technology
used
Type of information Users of the
information
Funding
Public
Strategic
dependent on
country e.g.
food security
related/ foreign
exchange
related
Regional/National/
to match geography
of trade
Public
institutions
Interviews,
observation by
reporters
Radio, email,
website,
bulletins,
notice board,
Prices, availability,
product
flow/quantities
transport costs,
farmers,
traders,
government
Government
donors
Private
Cereals, fish,
fruits, poultry
products and
pulses.
Fertilisers.
Regional/
national
Private
enterprises
Survey staff/
operators
(including market
players)
Market
information
point and
centres,
website, SMS,
Interactive
video response
(IVR), notice
boards and
Price and
availability,
quality/quantities,
inputs, weather
forecasts,
data/record
management.
Farmers,
market
players/
traders
Donors and
user fees,
shareholders
Professional
organisations/
NGOs
Cereals
vegetables and
livestock
National/
Sub-National/
regional
NGO/farmers’
organisations/
private
organisations
Interviews,
observation by
reporters,
Telephone
interviews
SMS, website,
radio,
magazine,
notice board,
billboards.
Prices, quantities
exchange,
quality/quantity,
market trends.
farmers/
market players
e.g. traders
Government
donors/
users’
subscription/
members’
contribution
Commodity
exchange
Traded
commodities
e.g. maize,
wheat, pulses,
coffee/ staple
foods
National/
sub-national/
regional
Private
enterprise
By product
transactions on
the exchange.
TV, electronic
ticker board,
print media,
SMS, toll-free
phone
exchange rate,
CIF/FOB prices,
grade, date/time,
volume traded
traders/buyers
and
smallholder
farmers/
farmer groups
e.g. cooperatives.
member
contribution
(e.g. ECX in
Ethiopia) and
government
funding
Source: Adapted from Galtier et al. (2014); David-Benz et al. (2015); Chitoah and Gyau (2016); Zhang et al. (2016);
and Staatz et al. (2014)
A more mixed range of funding has emerged for agricultural MIS. The public agencies continue
to rely primarily on government funding. The exchanges also tend to fund MIS as part of overall
corporate recurrent expenditure since the service is seen as important in maintaining
participation by market players. Most of the professional organisations and NGOs involved in
providing market information depend on donors or specific project-tied support. Even with
private providers, donor funding is usually critical in sustaining the activity even where internal
cross-subsidisation is pursued.
Impact and Lessons from 2GMIS
A review of selected cases of 2GMIS in non-OIC countries, some of which are reported in Chapter
3, shows that though it is difficult to ascertain whether MIS impacts on specific policies, it is
possible to link MIS to improved decision making with respect to certain issues (Galtier et al.,
2014). In Madagascar, for example, MIS data helped public policymakers to take actions which
moderated the impact of soaring market prices during the food price crisis in 2008 (ibid). In
particular, MIS helped to trigger an emergency response in times of crisis (ibid).
Staatz et al. (2014) have argued though that there are numerous difficulties in trying to measure
the impact of MIS due in part to the wide variety of dissemination techniques used. With respect
to reducing information asymmetries, however, most studies have explored the use of ICT
technology (rather than the MIS as a whole) in understanding whether these tools have been


