


 19 / 51

COMCEC Tourism Outlook-2016
12
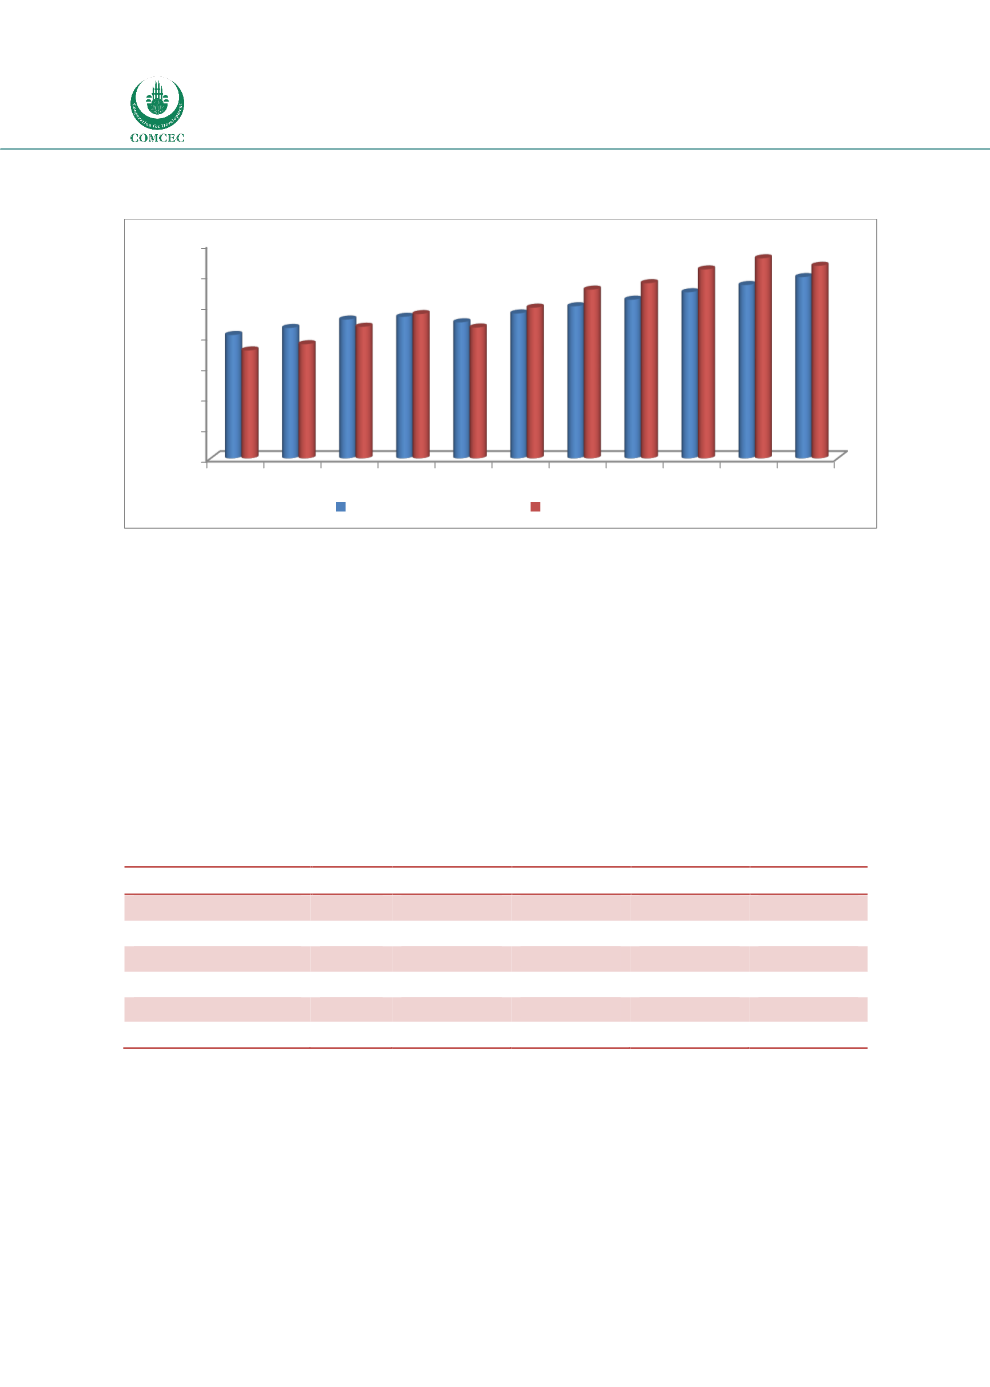
Figure 3.5 International Arrivals & Tourism Receipts (2005-2015)
Source: UNWTO
Earnings in euro area destinations for instance rendered 16% fewer US dollars in 2015
compared to 2014. As a result, total receipts in absolute US$ terms were US$ 49 bn lower in
2015 (US$ 1260 bn) than in 2014 (US$ 1309 bn).
Advanced economy destinations (+3.1%) recorded somewhat slower growth in receipts than
emerging economy destinations (+6.7%).
By region, the largest increase in receipts for the Americas was recorded as an increase +7.8%
(i.e. constant price change) in 2015. It is followed by Asia and the Pacific and the Middle East
both grew by 4%, while in Europe they grew by 3% and in Africa by 2%.
Table 3.3 International Tourism Receipts by Region (Billion $)
Tourism Receipts
2000
2013
2014
2015
Share (%)
World
475
1,197
1,309
1,206
100
Europe
234.5
491.7
513.5
450.7
35.8
Asia & Pacific
86.7
360.7
420.1
418.3
33.2
Americas
132.8
246.4
288.0
303.7
24.1
Africa
10.8
35.1
36.1
33.1
2.6
Middle East
12.7
45.1
51.6
54.4
4.3
Source: UNWTO, Tourism Highlights 2002&2013&2016 Edition
According to the UNWTO; Americas, which accounts for 24% of international tourism receipts
worldwide, shows the biggest growth and increased its tourism receipts by 8% in real terms to
US$304 billion. Many destinations benefited from the appreciation of US dollar, driving tourism
demand for the United States.
In Europe, international tourism receipts grew by 3% in real terms to US$ 451 billion,
representing 36% of worldwide receipts. The weaker Euro in 2015 has boosted the region’s
0
200
400
600
800
1000
1200
1400
2005 2006 2007 2008 2009 2010 2011 2012 2013 2014 2015
809 853 908 926 890
950 995
1.038 1.087 1.134
1186
706 747
861
944
856
986
1.104 1.146 1.236
1.309 1260
Arrivals (Millions)
Receipts (Billion US$)