


 10 / 113

COMCEC Trade Outlook 2017
4
The decline in the dollar value of world trade despite the slow growth in volume terms was
mostly due to the falling commodity prices and the depreciation of currencies against the US
dollar in 2016
1
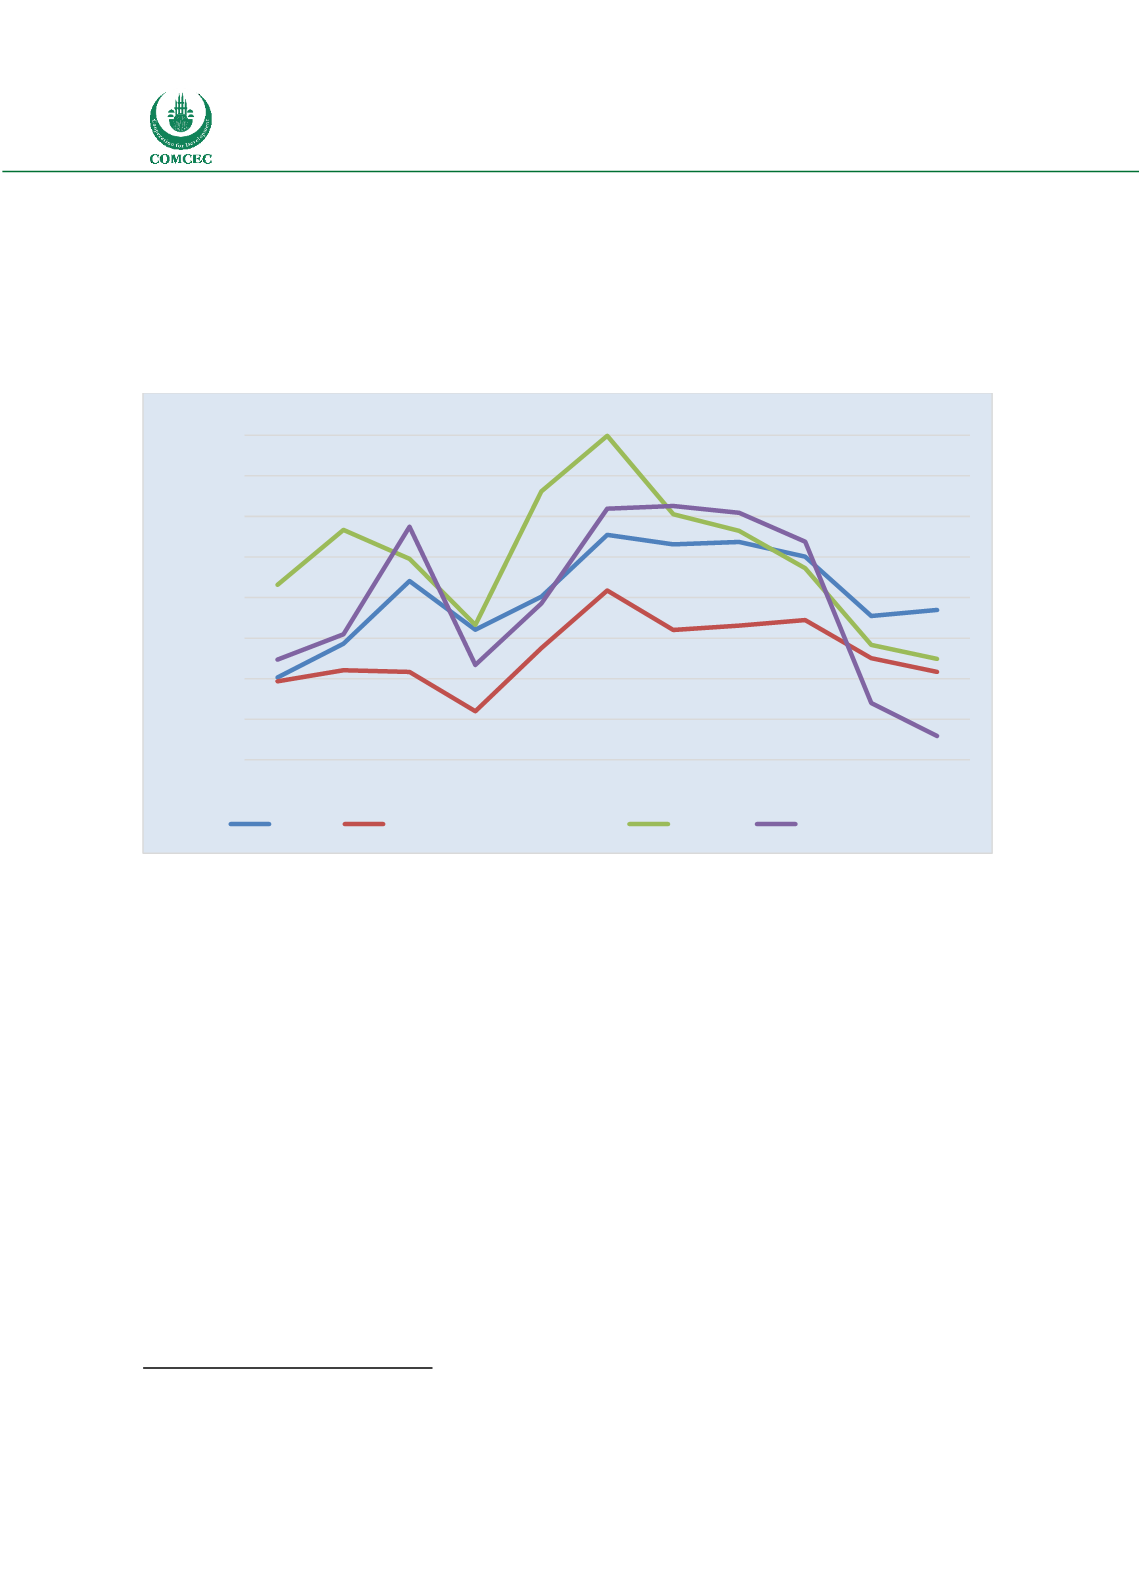
. Commodity prices which have been on a declining trend since 2012 fell by 10
per cent in 2016. Fuels continued to decline by 16.6 per cent in 2016 following the collapse (44.8
per cent) in 2015. While metals prices and agricultural rawmaterials fell by 5.4 per cent and 5.7
per cent respectively in 2016, food prices increased by 2.1 per cent year on year.
Figure 3: Evolution of the Commodity Prices
Both cyclical and structural factors accounted for the weak performance of world trade in 2016
including ongoing weakness in global economy, falling oil and other commodity prices, and
China’s rebalancing of demand composition. Import demand of both developed and developing
countries slowed in 2016, but it was the stagnation in developing countries imports demand
which accounted mainly for the weakness in world trade in 2016. Developed economies imports
grew by 2 per cent in 2016 down from 4.7 per cent in 2015 whereas developing economies
import demand further weakened to 0.2 per cent in 2016 down from 0.5 per cent in 2015.
Structural factors are estimated to have larger effect on recent slowdown in world trade. Among
the structural changes that contributed to global trade weakness are changes in the composition
of economic activity away from import-intensive investment, the maturation of global value
chains and slower pace of trade liberalization. China’s slower growth compared to previous
decade and shift away from investment and manufacturing to consumption and services
resulted in a lower import demand especially for minerals and metals. Moreover, investment
spending in the United States also declined in 2016. The decline in the import content of
investment in China and the US in turn led to lower import demand.
2
1
WTO 2017
2
WTO World Trade Statistical Review 2017
70
90
110
130
150
170
190
210
230
2006 2007 2008 2009 2010 2011 2012 2013 2014 2015 2016
Price Indices (2005=100)
Food
Agricultural raw materials
Metals
Fuel (Energy)