


 14 / 182

Improving the Role of Eximbanks/ECAs in the OIC Member States
6
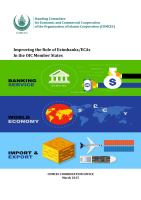
Figure 1: Berne Union New Business - Yearly (in Billion USD)
Source: Berne Union 2014
As Table 1 below shows, world exports have continued to grow steadily in the last five years. By
comparison, while merchandise exports of OIC countries surpassed USD 2.2 trillion in 2011 for
the first time in their history, they have been relatively flat in the subsequent years. OIC
countries’ share of world trade reached its peak in 2012 (11.5%). In terms of intra-regional
trade, volumes are still negligible, since they represent only 18.7% of OIC total exports.
2
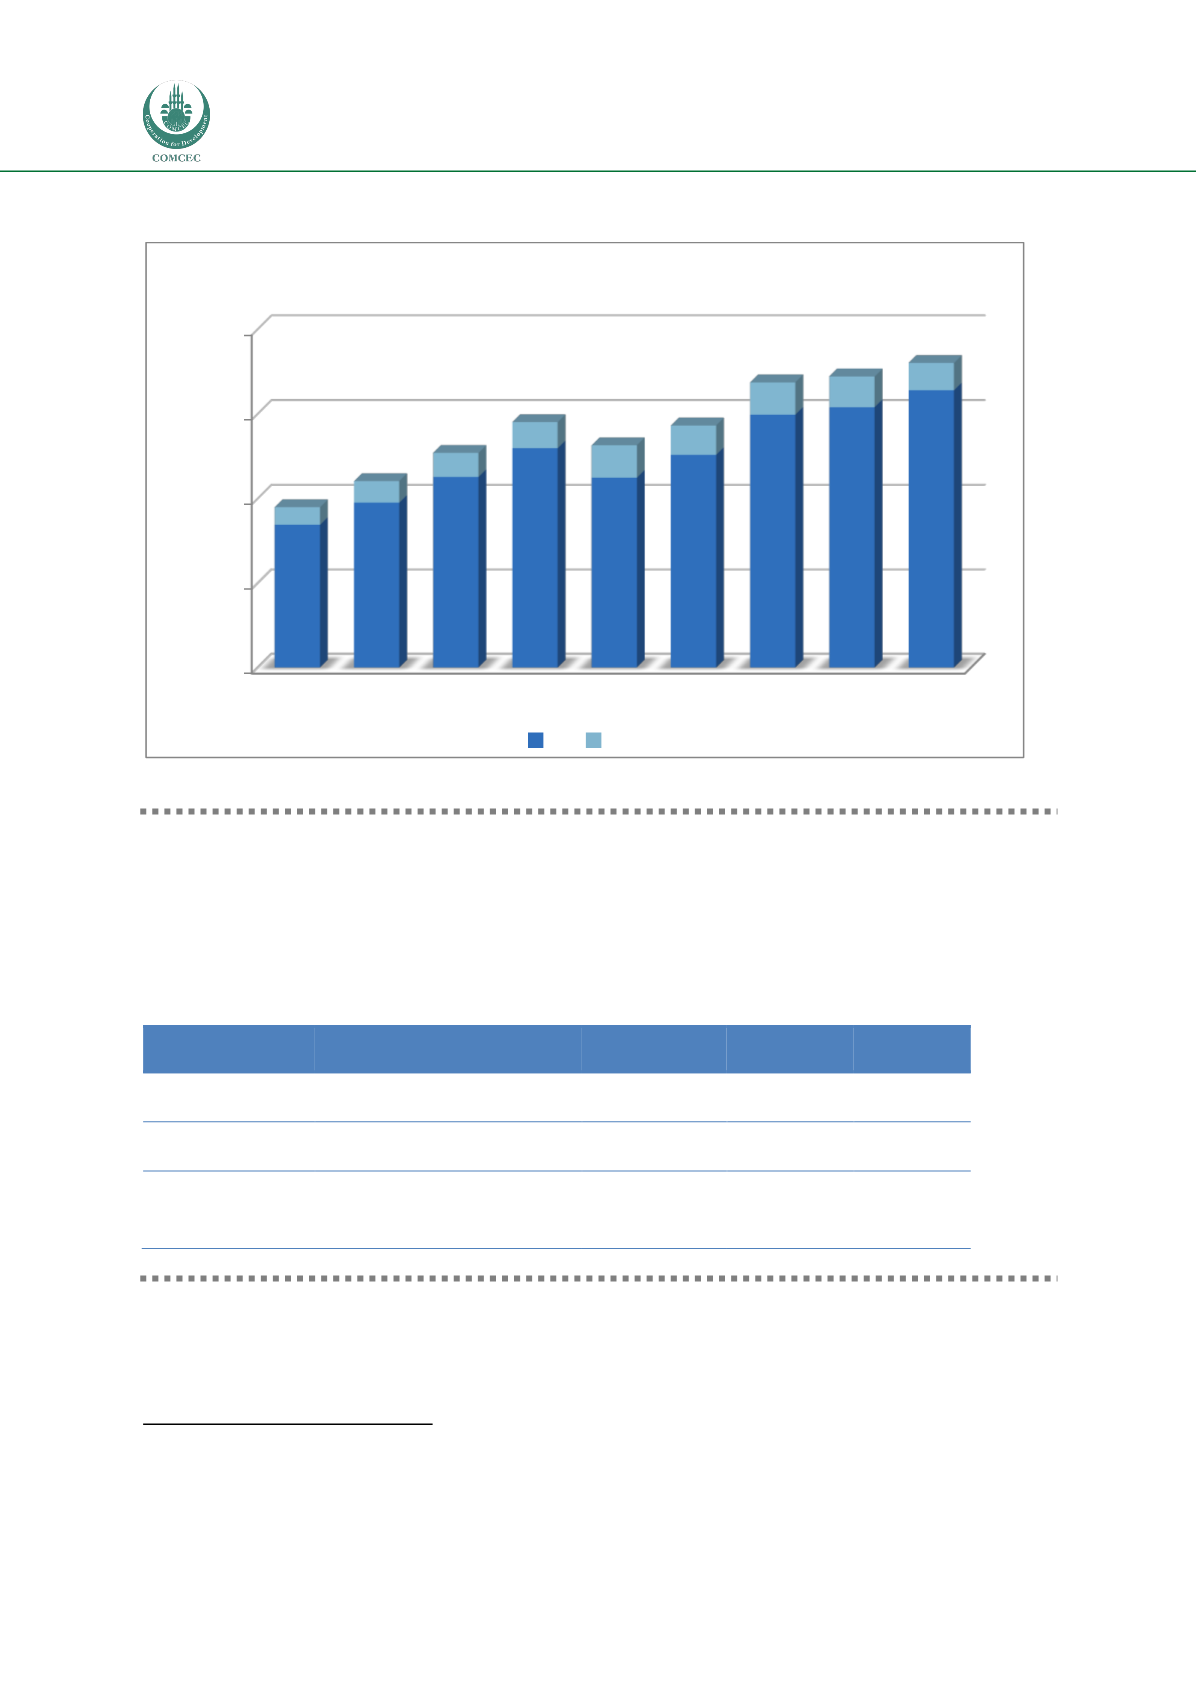
Table 1: Total Exports in USD Billions
2009
2010
2011
2012
2013
World
16,092.07 18,032.63
19,147.48
19,726.98
20,357.48
OIC Countries
1,329.35
1,680.77
2,122.48
2,261.77
2,215.79
OIC intra-
regional
207.93
257.71
325.41
362.1
381.77
Source: World data from OECD Statistics
3
and OIC data from ICDT-OIC.
4
The Berne Union business volumes (which include the substantial business volumes of the
private sector insurers) typically are equivalent to around 10 percent of world trade. A
traditional “rule of thumb” for the amount of business volumes relative exports of ECAs in the
OECD countries is between 4-6% of exports. According to the Aman Union of OIC export credit
2
Intra-regional trade is measured by a country’s imports from other OIC countries.
3
World export data source is OECD Statistics.
4
Export data source is Islamic Centre for Development of Trade (ICDT-OIC).
0
500
1000
1500
2000
2005 2006 2007 2008 2009 2010 2011 2012 2013
844
975
1,127
1,297
1,123
1,258
1,495 1,539 1,640
104
127
142
154
191
173
191
182
161
ST MLT