


 121 / 203

Special Economic Zones in the OIC Region:
Learning from Experience
100
Increasing export values; and
Attracting further FDI inflows.
This analysis is presented below i
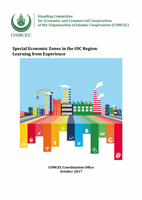
n Figure 23 an
d Figure 24.Figure 23 - Singapore GDP per Capita (constant $)
Source: World Bank (2017) World Bank Open Data. Available from
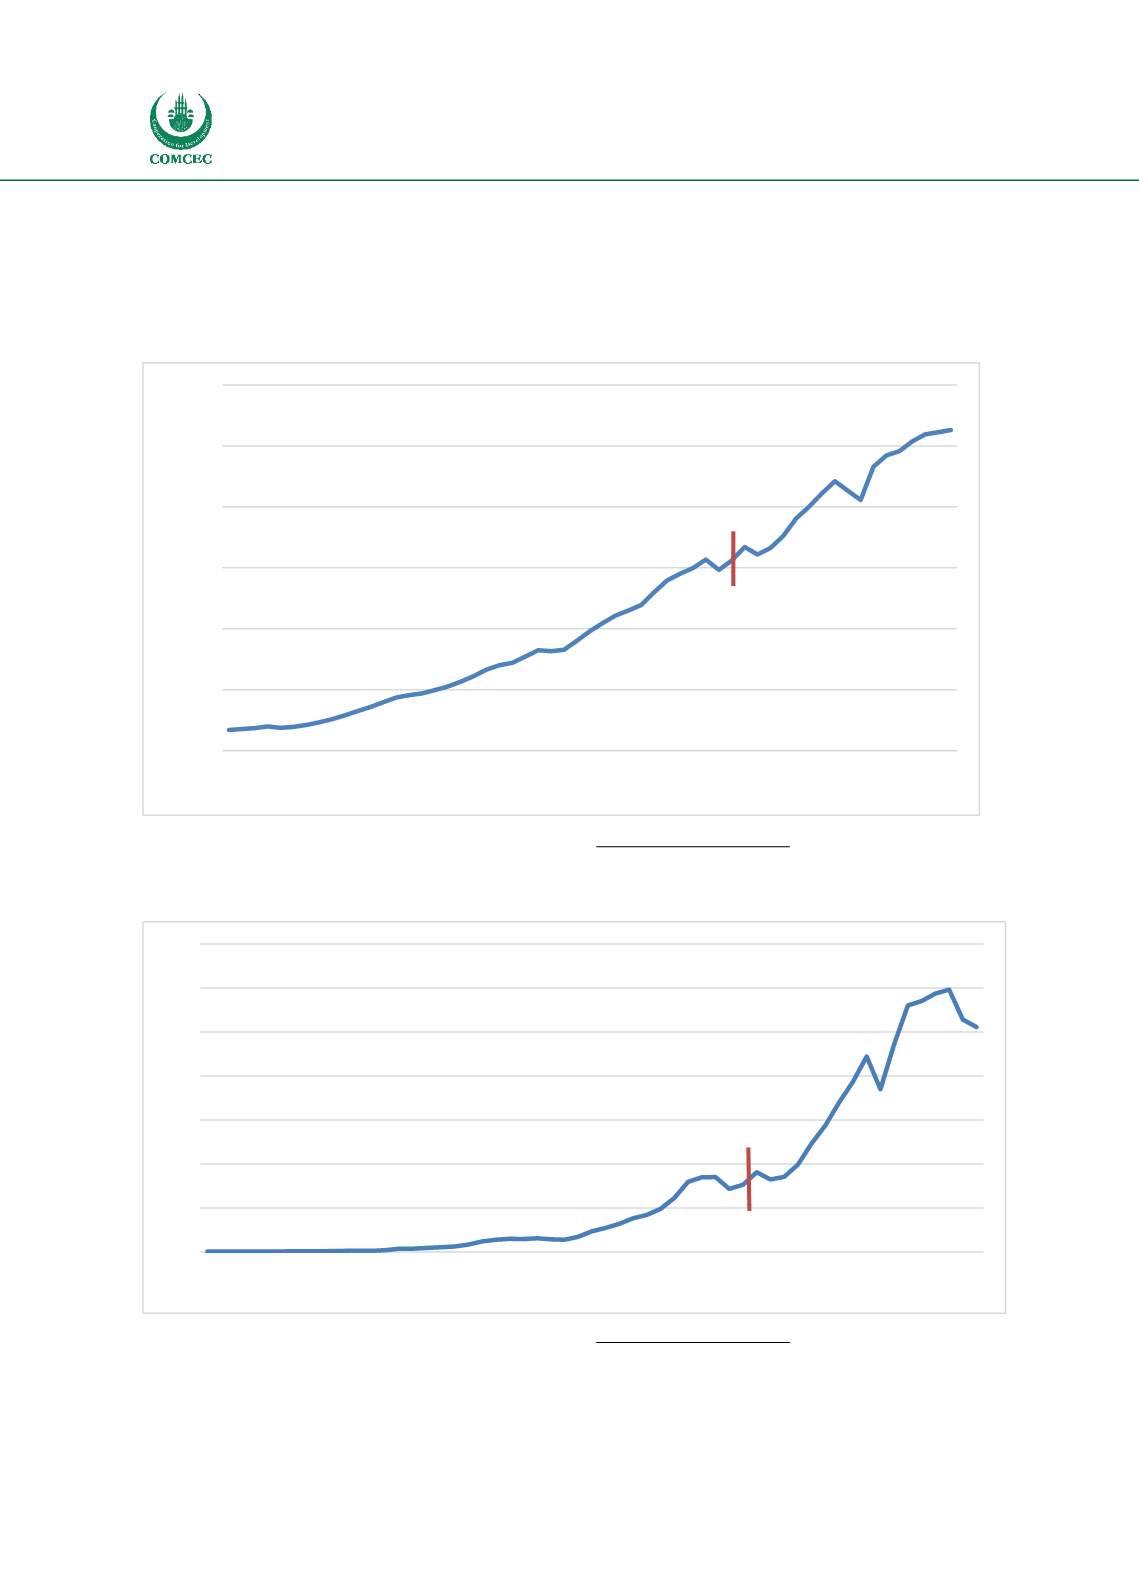
: https://data.worldbank.org/Figure 24 - Singapore Export Values ($Bn)
Source: World Bank (2017) World Bank Open Data. Available from
: https://data.worldbank.org/The analysis presented above indicates that the economic performance of Singapore with
regards to GDP per capita growth and exports improved considerably following the opening of
0
10000
20000
30000
40000
50000
60000
1960
1962
1964
1966
1968
1970
1972
1974
1976
1978
1980
1982
1984
1986
1988
1990
1992
1994
1996
1998
2000
2002
2004
2006
2008
2010
2012
2014
2016
Jurong Island SEZ
0
100
200
300
400
500
600
700
1960
1962
1964
1966
1968
1970
1972
1974
1976
1978
1980
1982
1984
1986
1988
1990
1992
1994
1996
1998
2000
2002
2004
2006
2008
2010
2012
2014
2016
Jurong Island SEZ