


 161 / 213

COMCEC
Reducing Food Waste
In the OIC Member Countries
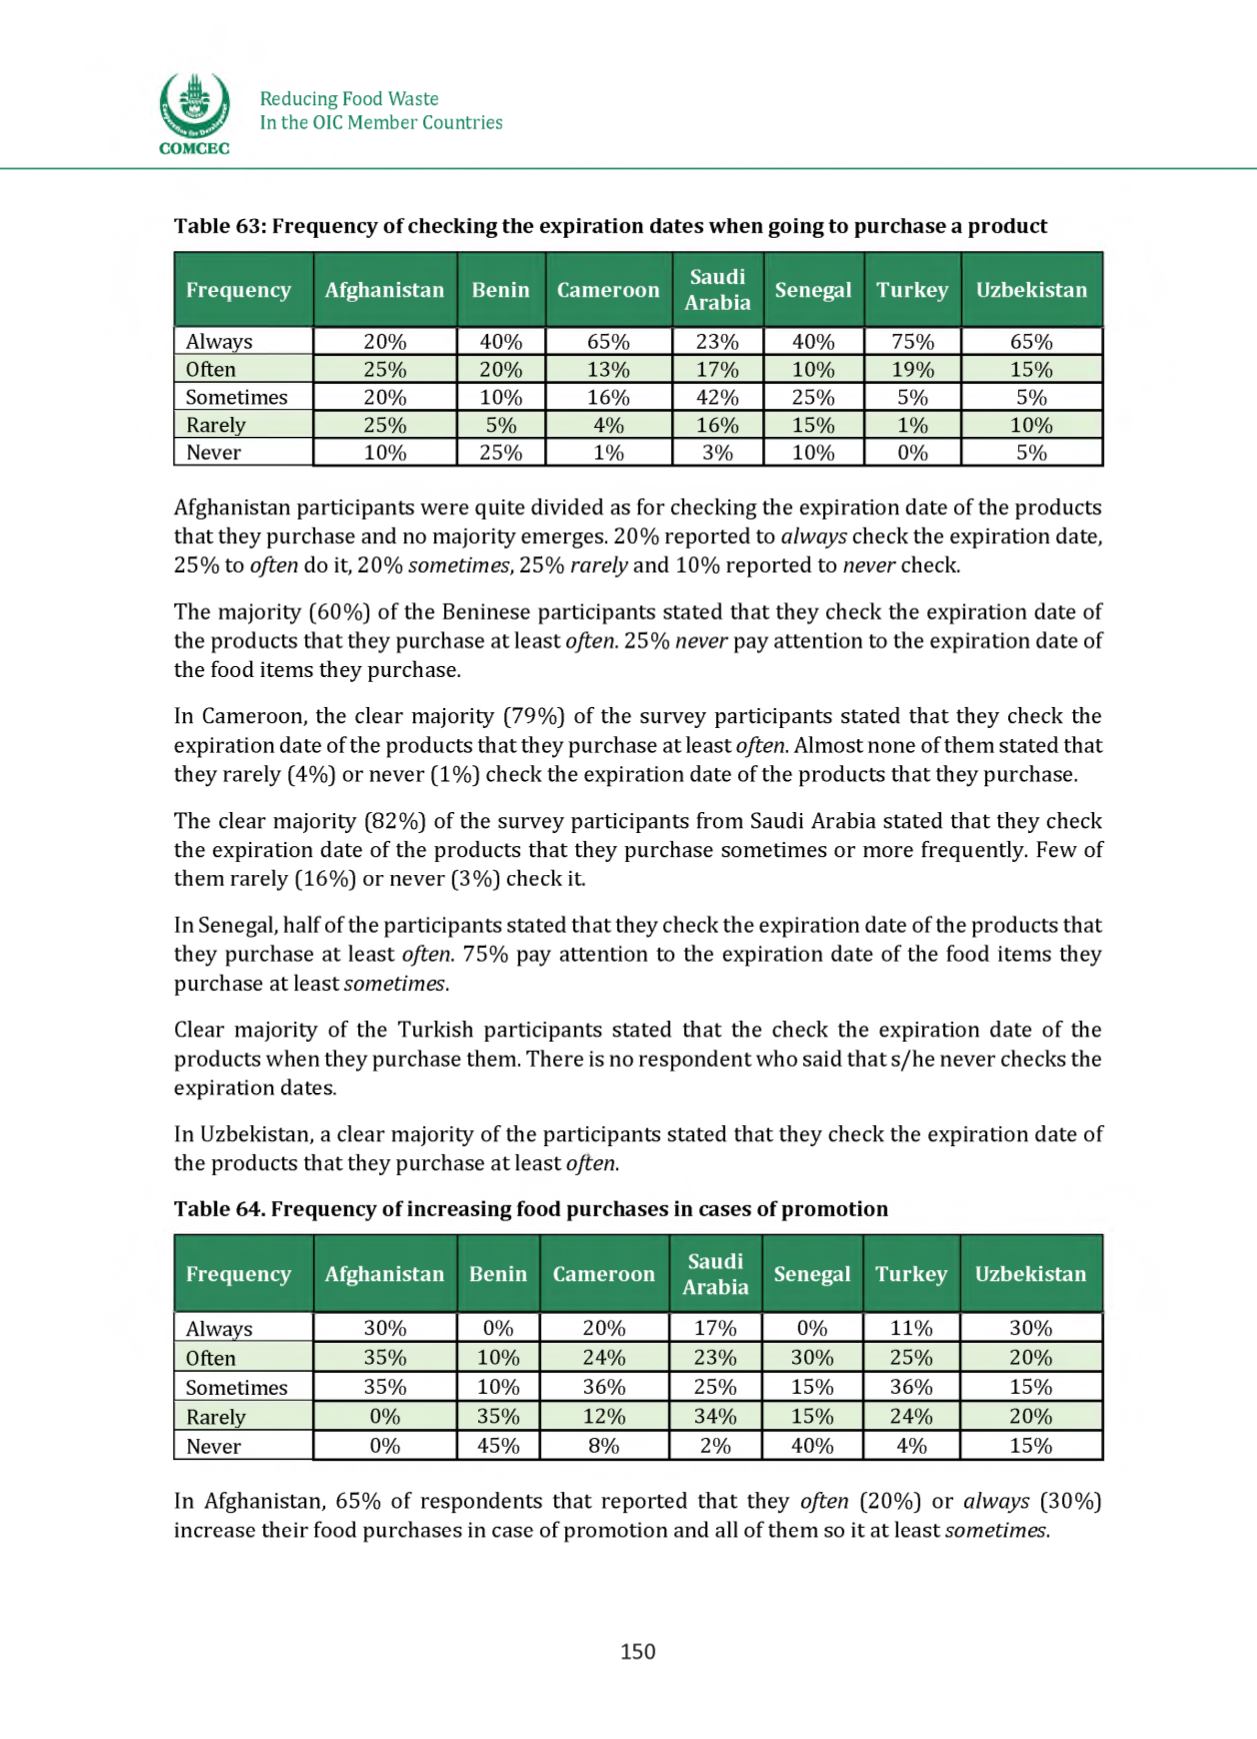
Table 63: Frequency of checking the expiration dates when going to purchase a product
Frequency Afghanistan Benin Cameroon
Saudi
Arabia
Senegal Turkey Uzbekistan
Always
20%
40% 65% 23% 40% 75%
65%
Often
25%
20% 13% 17% 10% 19%
15%
Sometimes
20%
10% 16% 42% 25% 5%
5%
Rarely
25%
5%
4%
16% 15% 1%
10%
Never
10%
25%
1%
3% 10% 0%
5%
A fghanistan participants were quite divided as for checking the expiration date of the products
tha t they purchase and no m ajority emerges. 20% reported to
always
check the expiration date,
25% to
often
do it, 20%
sometimes,
25%
rarely
and 10% reported to
never
check.
The m ajority (60% ) o f the Beninese participants stated tha t they check the expiration date of
the products tha t they purchase at least
often.
25%
never
pay attention to the expiration date of
the food items they purchase.
In Cameroon, the clear majority (79% ) of the survey participants stated th a t they check the
expiration date of the products tha t they purchase at least
often.
A lmost none of them stated tha t
they rarely (4% ) or never (1% ) check the expiration date of the products tha t they purchase.
The clear m ajority (82% ) of the survey participants from Saudi Arabia stated th a t they check
the expiration date of the products tha t they purchase sometimes or more frequently. Few of
them rarely (16% ) or never (3% ) check it.
In Senegal, ha lf of the participants stated th a t they check the expiration date of the products tha t
they purchase at least
often.
75% pay attention to the expiration date of the food items they
purchase at least
sometimes
.
Clear m ajority of the Turkish participants stated tha t the check the expiration date o f the
products w hen they purchase them. There is no responden t who said tha t s/he never checks the
expiration dates.
In Uzbekistan, a clear majority of the participants stated tha t they check the expiration date of
the products tha t they purchase at least
often.
Table 64. Frequency of increasing food purchases in cases of promotion
Frequency Afghanistan Benin Cameroon
Saudi
Arabia
Senegal Turkey Uzbekistan
Always
30%
0% 20% 17% 0% 11%
30%
Often
35% 10% 24% 23% 30% 25%
20%
Sometimes
35% 10% 36% 25% 15% 36%
15%
Rarely
0%
35% 12% 34% 15% 24%
20%
Never
0%
45% 8%
2% 40% 4%
15%
In Afghanistan, 65% o f respondents tha t reported tha t they
often
(20% ) or
always
(30% )
increase their food purchases in case of p rom o tion and all of them so it at least
sometimes.
150