


 58 / 283

National and Global Islamic Financial Architecture:
Problems and Possible Solutions for the OIC Member Countries
40
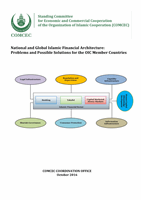
Chart
2.26: Geographical Distribution of Global Sukuk Issues
Source: Calculated from IIFM Sukuk Report 2016
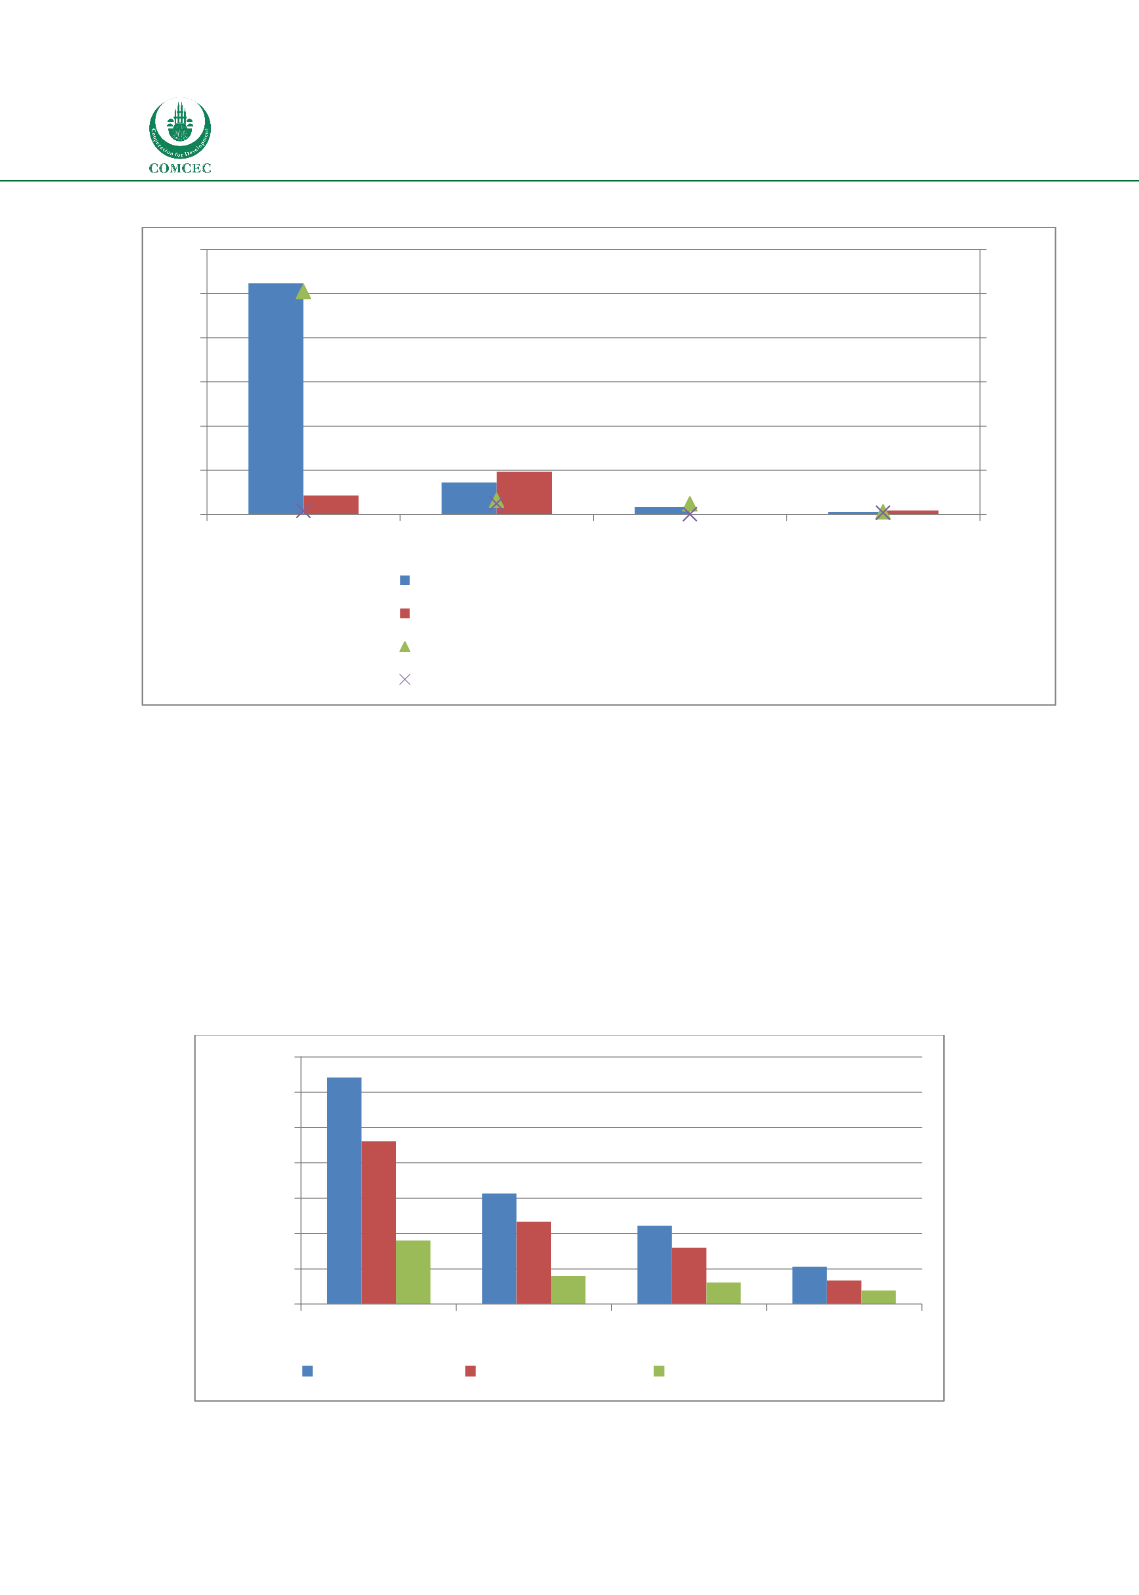
Charts 2.27 and 2.28 show sukuk issuances by different types of issuers, with the former
showing the total sukuk outstanding as of 31 December 2015 and the latter showing the
issuances in 2015. Chart 2.27's depiction of the total sukuk outstanding as of December 2015
was USD 321 billion of which USD 230.6 billion were domestic and USD 90.4 billion were
international. The distribution of the outstanding balances of the total was highest for the
corporates (USD 156.9 billion) followed by sovereign (USD 111 billion) and quasi-sovereign
(USD 53.1 billion). The corresponding figures for domestic and international outstanding
sukuk are given in Chart 2.27. Note that while global sukuk indicates the value of all sukuk
issued globally, international sukuk are those that are sold beyond national borders to both
national and international investors, as opposed to domestic markets only.
Chart
2.27: Total Sukuk Outstanding as of 31 Dec 2015 (USD, bn.)
Source: Calculated from IIFM Sukuk Report 2016
523,6
72,2
16,9
5,6
43,0
96,7
0,6
8,5
5038
320
240
57
78
243
2
36
0
1000
2000
3000
4000
5000
6000
0
100
200
300
400
500
600
Asia & Far East
GCC & Middle East
Africa
Europe & Others
Total Domestic Sukuk Issuances (US$, bn.)
Total International Sukuk Issuances (US$, bn.)
Total Domestic Sukuk Issuances (No. of Issues)
Total International Sukuk Issuances (No. of Issues)
321,0
156,9
111,0
53,1
230,6
116,8
80,1
33,7
90,4
40,1
30,9
19,4
0
50
100
150
200
250
300
350
Total
Corporate
Sovereign Quasi-Sovereign
USD (bn.)
Global Sukuk Domestic Sukuk International Sukuk