


 64 / 176


Improving Banking Supervisory Mechanisms
In the OIC Member Countries
47
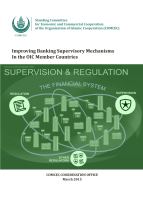
Table 13: Supervisory Power Index (Selected OIC Countries)
Source: World Bank, Bank Regulation and Supervision Survey
OIC average for the measure of the supervisory power exhibits a decline after the crisis period
in a comparison to the previous surveys, which holds for different income groups. The average
degree of the power of the supervisory authorities in selected member countries is close to the
EU-27 average and slightly below the corresponding average for US. Indonesia, Pakistan,
Turkey, Malaysia and Nigeria have values above 10 which indicate relatively powerful
supervisory authorities, whereas Kazakhstan and UAE exhibit a declining trend in regulatory
power of the supervisory authorities especially in the period after the 2008 crisis.
Table 14: Supervisory Power Index
Source: World Bank, Bank Regulation and Supervision Survey
An equally important aspect for the supervision is the independence and experience of the
supervisory authority. In some countries, there are multiple authorities which might lead to
conflicts in the implementation of the regulations. In order to assess these differences we use
structural variables on the supervision together with a measure of autonomy of the
supervisory authority.
The information on the structure of the supervision in the selected OIC member countries in a
comparison to EU-27 and US and OIC averages is provided in Table 15. The first raw indicates
the tenure of the supervisor for the four surveys conducted by the World Bank. Tenure of the
supervisor is an important measure for the success of the supervision as it represents the
accumulated experience in the regulation and supervision. In this regard, selected OIC member
Supervisory
Power
Index
Survey Indonesia Kazakhstan Malaysia Nigeria Pakistan Turkey UAE Saudi Arabia Algeria
Selected
OIC
Average
2000 12,00
14,00
12,92 11,00 14,00 11,00 14,00 14,00
14,00
12,99
2003 16,00
13,00
13,50 13,00 14,00 15,50 14,00 14,00
14,50
14,17
2007 16,00
9,00
15,50 13,50 14,00 15,50 N/A.
13,00
11,50
13,50
2011 13,00
6,46
11,00 10,77 13,00 12,00 9,00
N/A
N/A
10,75
Supervisory
Power Index
Survey
Selected
OIC
Average
OIC
Average
OIC-High
Income
Average
OIC-Upper-
Middle
Income
Average
OIC-
Lower-
Middle
Income
Average
OIC-Low
Income
Average
EU-27
Average
United
States
2000
12,99 11,43 12,90
12,82
13,02 13,15 10,49 13,00
2003
14,17 11,91 14,01
13,86
13,74 13,77 10,45 13,00
2007
13,50 11,61 13,02
13,46
12,68 12,68 10,88 14,50
2011
10,75 10,32 10,52
10,92
10,63 10,35 11,00 13,00