


 13 / 127

Barriers and Opportunities for Enhancing Capital Flows
In the COMCEC Member Countries
5
1 – CAPITAL FLOW TRENDS IN THE COMCEC MEMBER
COUNTRIES
A volatile decade for global capital flows
Capital flows have increased markedly on a global level since the early part of the last decade.
According to the
World Economic Outlook
published by the International Monetary Fund (IMF),
net private capital flows to 143 emerging markets and five small open economies rose to
$600bn in 2007, from $90bn in 2002. For its part, the Institute of International Finance (IIF),
whose definition of capital flows differs slightly from that of the IMF, estimated that in 2007
the figure was around $780bn.
However, the unprecedented levels of private capital flows to developing countries that were
seen during that time came to an abrupt halt in the second half of 2008 as capital markets
seized up following the collapse of Lehman Brothers, a large US investment bank, and the
world economy went into recession. Some of the portfolio capital flowed back to the major
industrial countries that had been at the epicentre of the crisis in the first place. IMF data
shows that the drop in net inflows to emerging economies in the second half of 2008 was
accompanied by a rise in net inflows to advanced economies
1
.
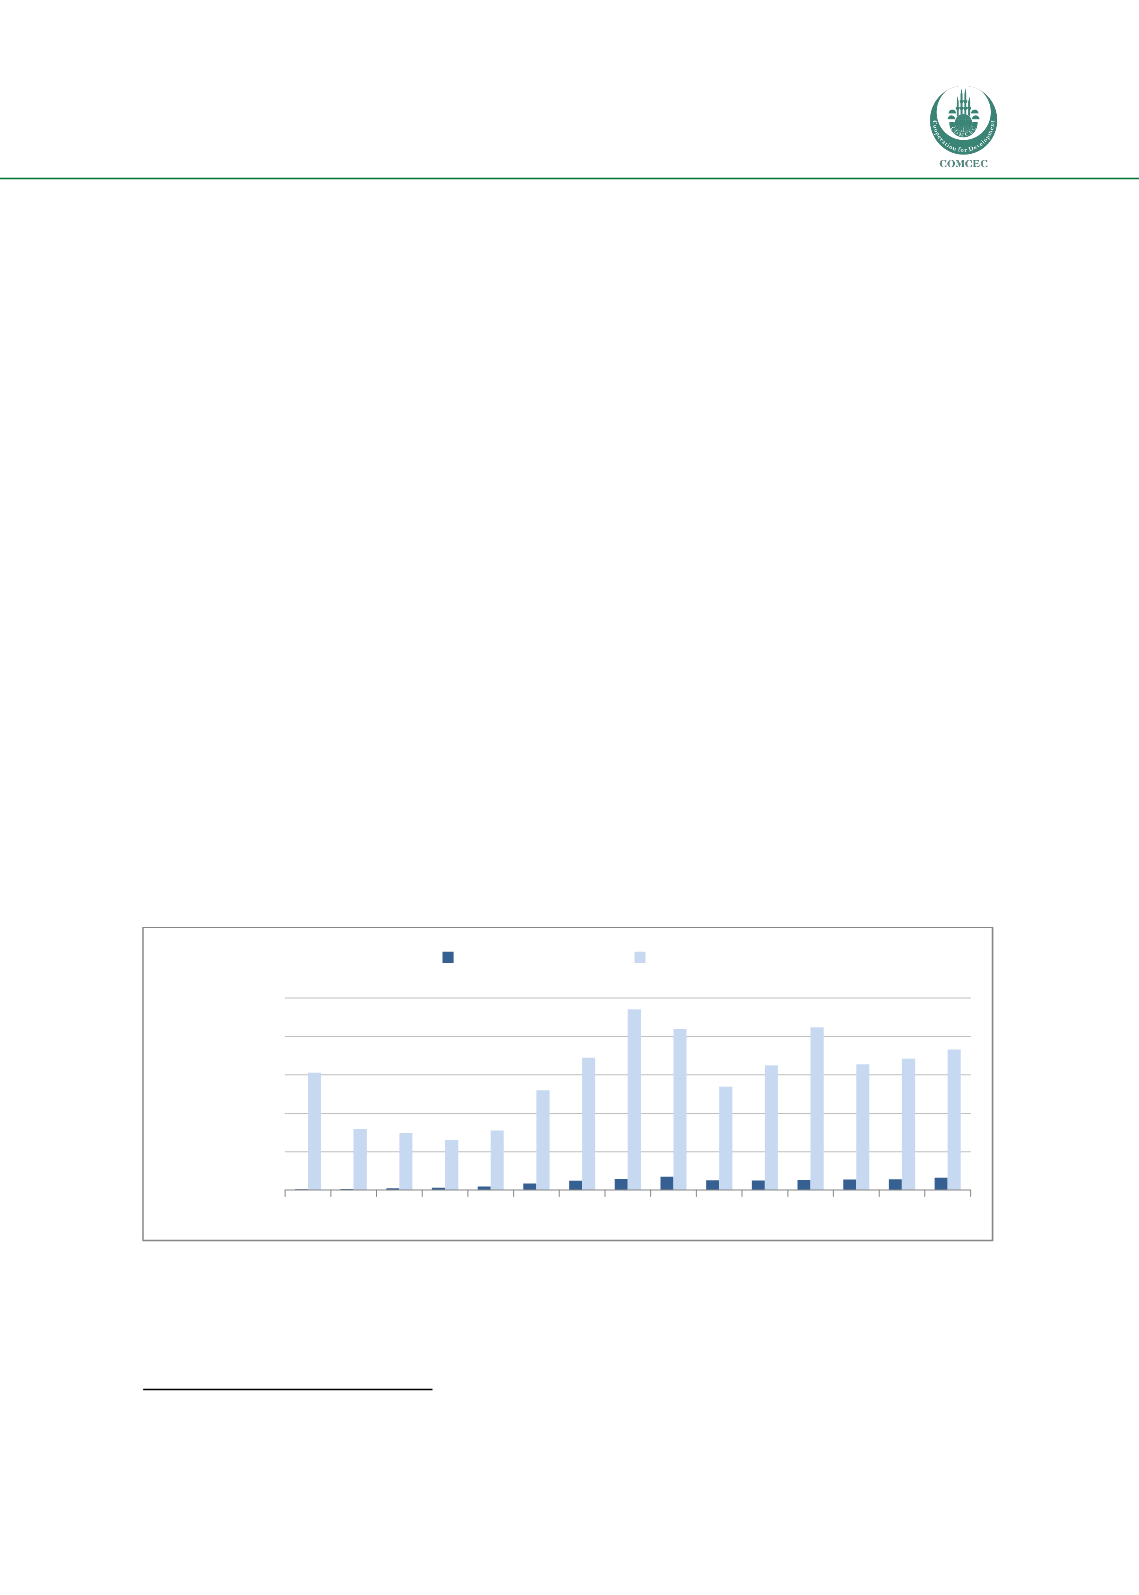
As for the share of capital inflows to the COMCEC Member Countries relative to global capital
inflows, this has remained relatively small over the last decade or so. Figure 1.1 below shows
how inward direct investment on a global level dropped off in 2009 after the global economic
recession, rising strongly until 2011, when in 2012 it decreased once again.
Figure 1.1 Inward direct investments to the COMCEC Member Countries relative to the
world
Source: EIU Country Data
Note: No global figure available for inward portfolio investment and medium and long
term debt flows. COMCEC aggregate excludes Afghanistan, Brunei, Guinea-Bissau,
Maldives, Somalia, Suriname, and Uzbekistan.
1
Bluedorn, Duttagupta, Guajardo and Topalova, 'Capital Flows are Fickle: Anywhere, Anytime' August 2013, IMF Working Paper
0
500
1000
1500
2000
2500
2000 2001 2002 2003 2004 2005 2006 2007 2008 2009 2010 2011 2012 2013 2014
Inward Direct Investment,
US$ (bn)
COMCEC countries World