


 11 / 62

COMCEC Poverty Outlook 2019
3
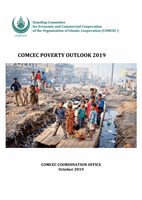
Figure 1: GDP Per Capita (PPP) (Current International $)
Source: Own calculations from World Development Indicators of the World Bank
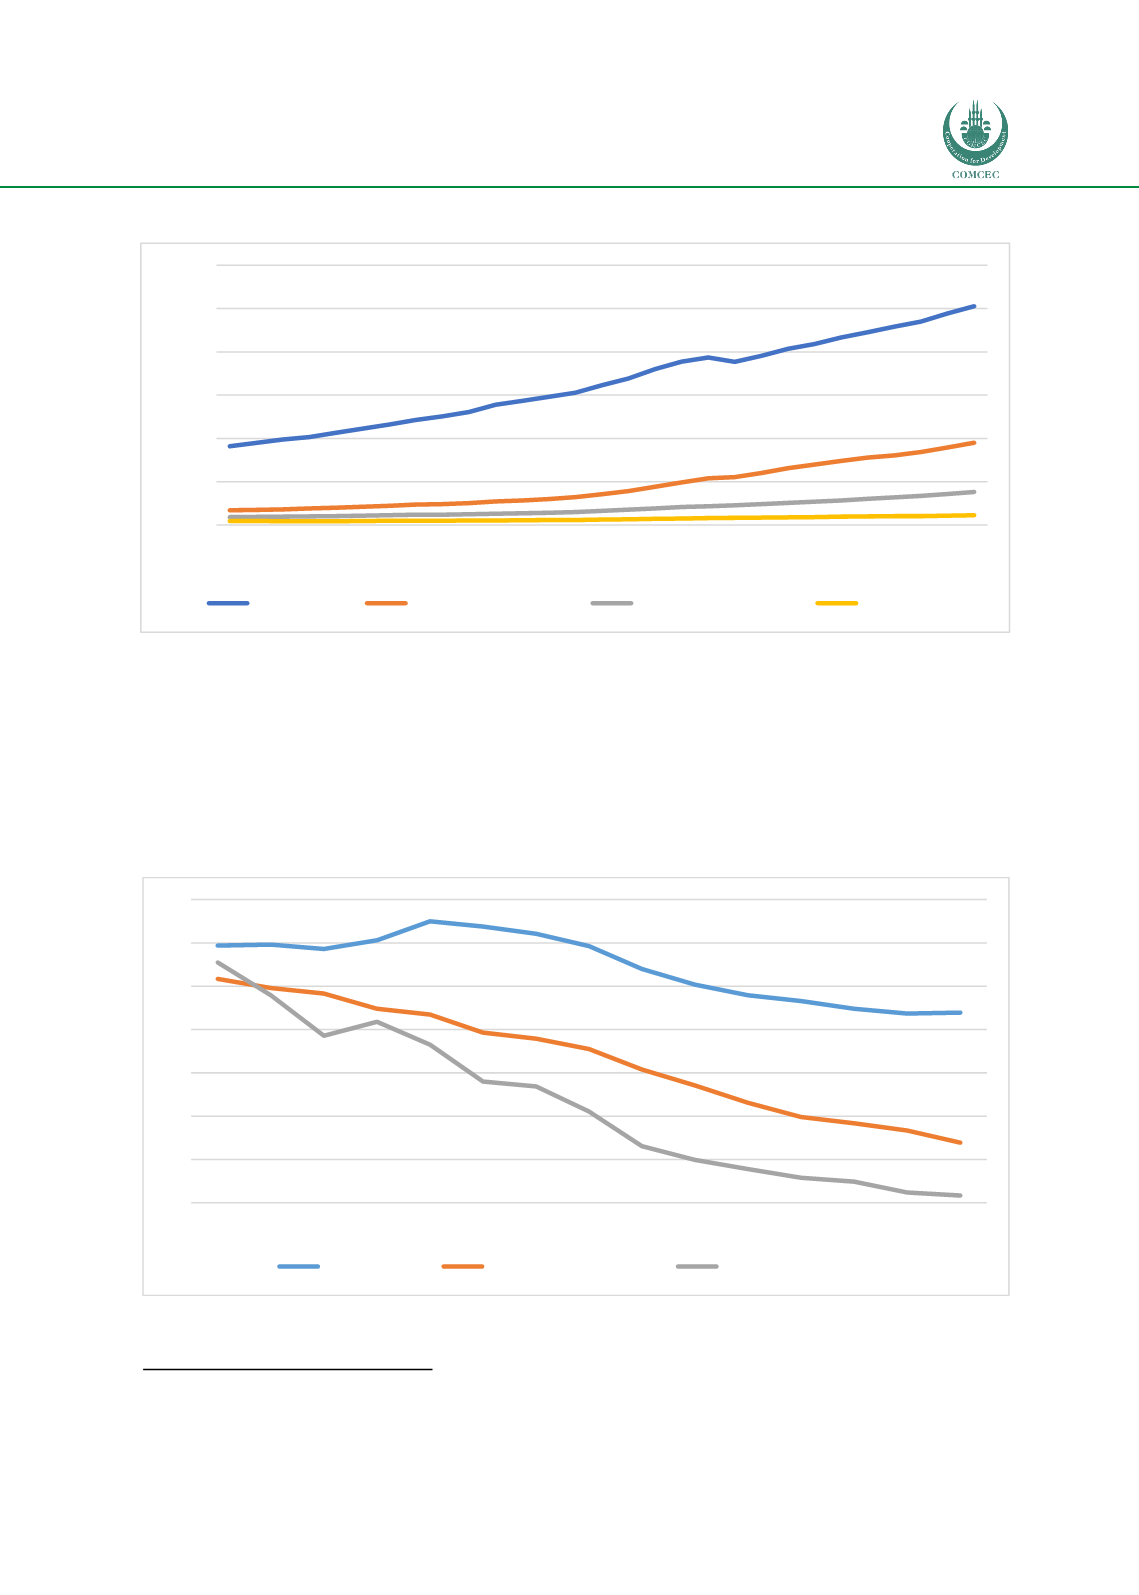
For most countries, poverty levels decreased inmonetary terms for the last three decades. Indeed,
for the period 1981-2018 a significant progress was recorded in terms of the ratio of people who
live under US$1.90. While, this ratio was 41.8 percent for upper-middle income countries, 44.8
percent for lower-middle income countries and 60,6 percent for low income countries in 1990,
these ratios fell to 1.7 percent, 13.9 percent and 43.9 percent respectively for the so-called income
groups in 2015
(Figure 2).
7
Figure 2: Poverty Headcount Ratio at US$1.90 a day (PPP) (% of Population)
Source: World Bank
7
Latest figure available is for 2015.
59,4
43,9
51,7
13,9
55,5
1,7
0
10
20
30
40
50
60
70
1981 1984 1987 1990 1993 1996 1999 2002 2005 2008 2010 2011 2012 2013 2015
Low income
Lower middle income
Upper middle income
0
10000
20000
30000
40000
50000
60000
1990
1991
1992
1993
1994
1995
1996
1997
1998
1999
2000
2001
2002
2003
2004
2005
2006
2007
2008
2009
2010
2011
2012
2013
2014
2015
2016
2017
2018
High income
Upper middle income
Lower middle income
Low income