


 29 / 55

COMCEC Tourism Outlook 2017
21
relative to the currencies of its source markets. Similarly, it becomes less affordable, when its
currency appreciates against the currencies of its visitors. An appreciating currency increases
the purchasing power of a country’s travelers abroad, but makes the destinationmore expensive
for international generating markets against whose currencies it has appreciated.
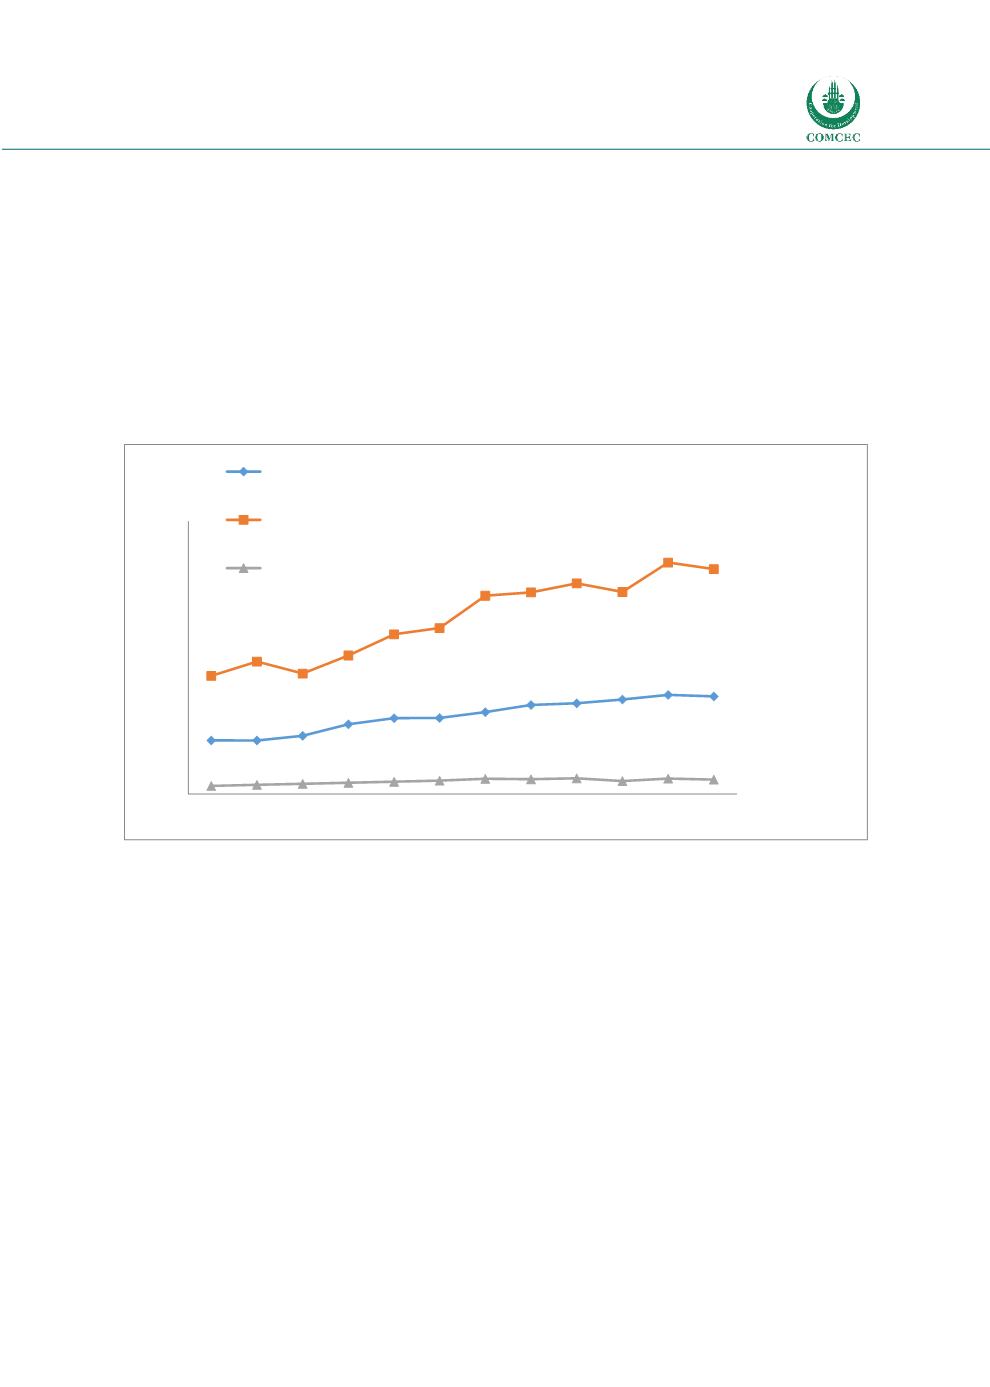
It can be useful to analyze the trends by grouping the OIC member countries as OIC-MENA, OIC-
Asia, and OIC-Sub-Saharan Africa, which are provided at Figure 4.4. As displayed in the figure
OIC-MENA has the biggest share among tourist arrivals in the member states. In this region, the
number of tourist arrivals is forecasted to decrease from 119 million to 116 million in 2015
according to available data.
Figure 4.4 Tourist Arrivals in the OIC Sub-Regions (Millions)
Source: UNWTO Tourism Highlights 2006, 2009 and 2016 Editions.
Figure 4.4 shows that OIC-Asia has experienced continued growth in tourist arrivals for the
period 2004-2014. However, in 2015, 50 million tourists travelled to OIC-Asia region. The OIC-
Sub Saharan Africa constitutes the smallest portion of the international OIC Tourism. Similar
analysis can bemade for tourism receipts in these groups. Figure 4.5 shows that tourism receipts
in OIC-MENA is greater than the other two regions.
28
27
30
36 39 39 42 46 47 48 51 50
61
68
62
71
82 85
102 104
108 104
119 116
4 5 5 6 6 7 8 8 8 7 8 7
0
20
40
60
80
100
120
140
2004 2005 2006 2007 2008 2009 2010 2011 2012 2013 2014 2015
OIC-ASIA
OIC MENA
OIC SUB-SAHARAN AFRICA