


 30 / 56

COMCEC Tourism Outlook-2018
20
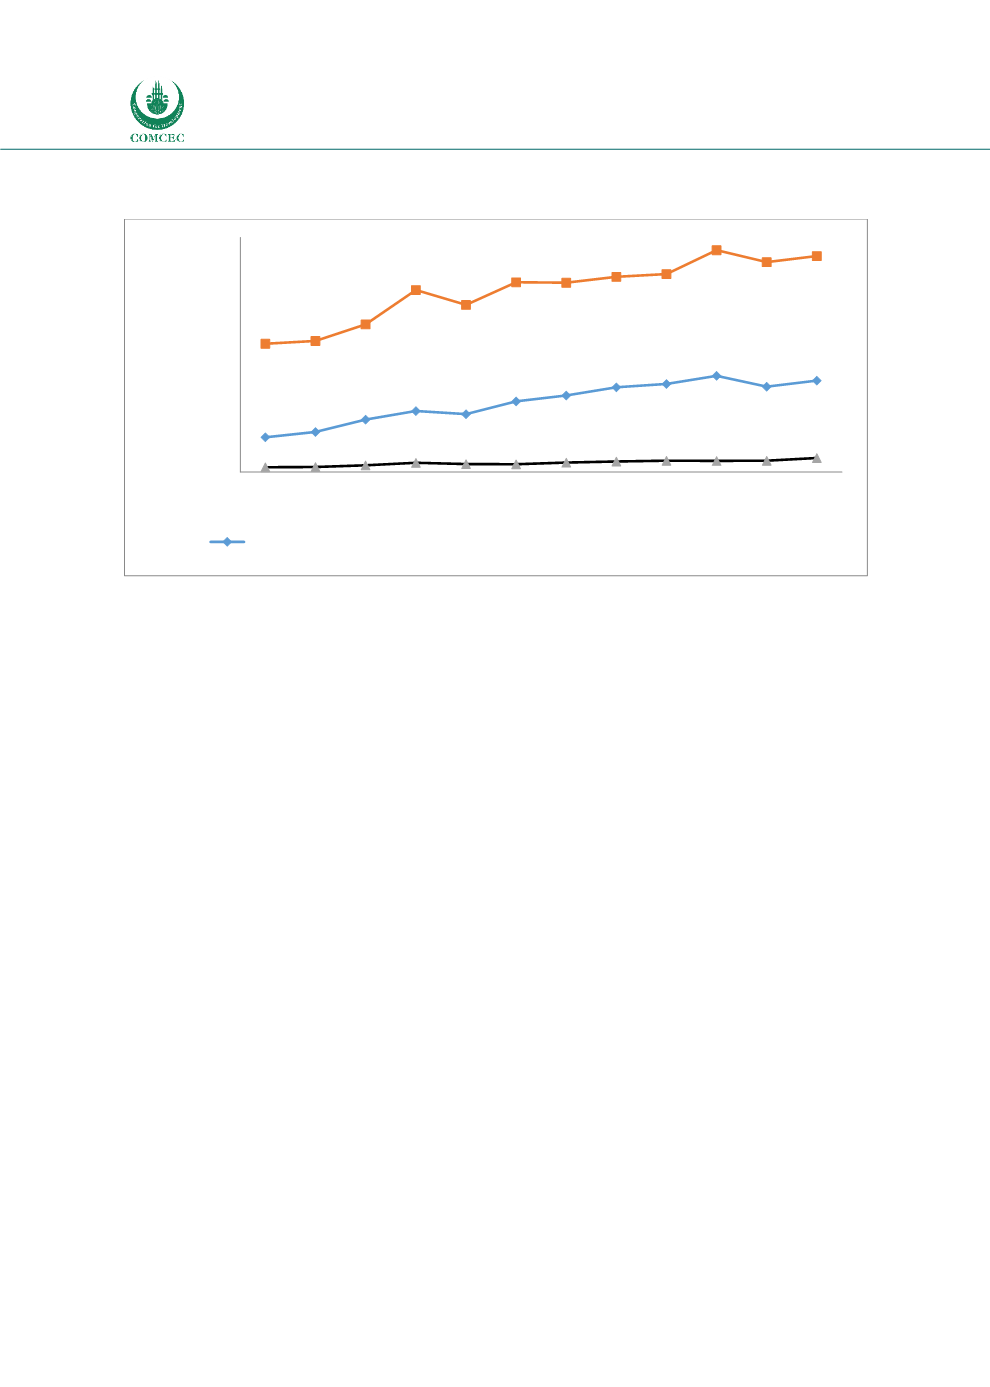
Figure 0.5 Tourism Receipts in the OIC Sub-Regions
Source: UNWTO Tourism Highlights 2006, 2009 and 2016 Editions.
According to available data, tourism receipts in OIC Mena increased from $89 billion in 2015 to
$92 billion in 2016. It is important to note that exchange rate fluctuations can represent
comparisons in total spending between countries, as well as changes in absolute terms over
time. For example, if the US dollar appreciates versus the currency of one-member state, tourism
spending in this country translates into a lower amount of US dollars from one year to another.
This does not necessarily mean that spending was lower, but simply that the same amount of
that country’s currency converts into less dollars.
The distribution of the tourist arrivals and tourism receipts among the OIC Member States has
demonstrated the fact that international tourism in the Member Countries is concentrated in a
few countries. In terms of tourist arrivals, Turkey, Malaysia, Saudi Arabia, Morocco, United Arab
Emirates (UAE), Egypt, Indonesia, Tunisia, Iran and Kazakhstan were the top 10 international
tourist destinations among the Member Countries in 2016. As shown in the Figure 4.6, these 10
countries together hosted 136.5 million international arrivals in 2016.
15
17
22
26
25
30
33
36
38
41
36 39
55
56
63
78
71
81
81
83
84
95
89 92
2
2
3
4
3
3
4
5
5
5
5
6
-
10
20
30
40
50
60
70
80
90
100
2005 2006 2007 2008 2009 2010 2011 2012 2013 2014 2015 2016
OIC-ASIA