


 35 / 101

COMCEC Agriculture Outlook 2017
25
Freshwater is a highly valuable resource as there are large number of competing demands,
including drinking water, irrigation, hydroelectricity, waste disposal, industrial processes,
transport and recreation, as well as ecosystem functions and services. As mentioned above,
agricultural sector is the most important user (with 70 percent) of all freshwater used by
humans among the competing sectors at the global level.
9
In the OIC, agriculture sector
consumes 86 percent of the total fresh water which is higher than the world average.
10
In
developing regions like Africa and Asia, agriculture uses more fresh water. On the other hand,
the share of agriculture in water consumption is lower in continents having high level of
precipitation than arid and semi-arid ones.
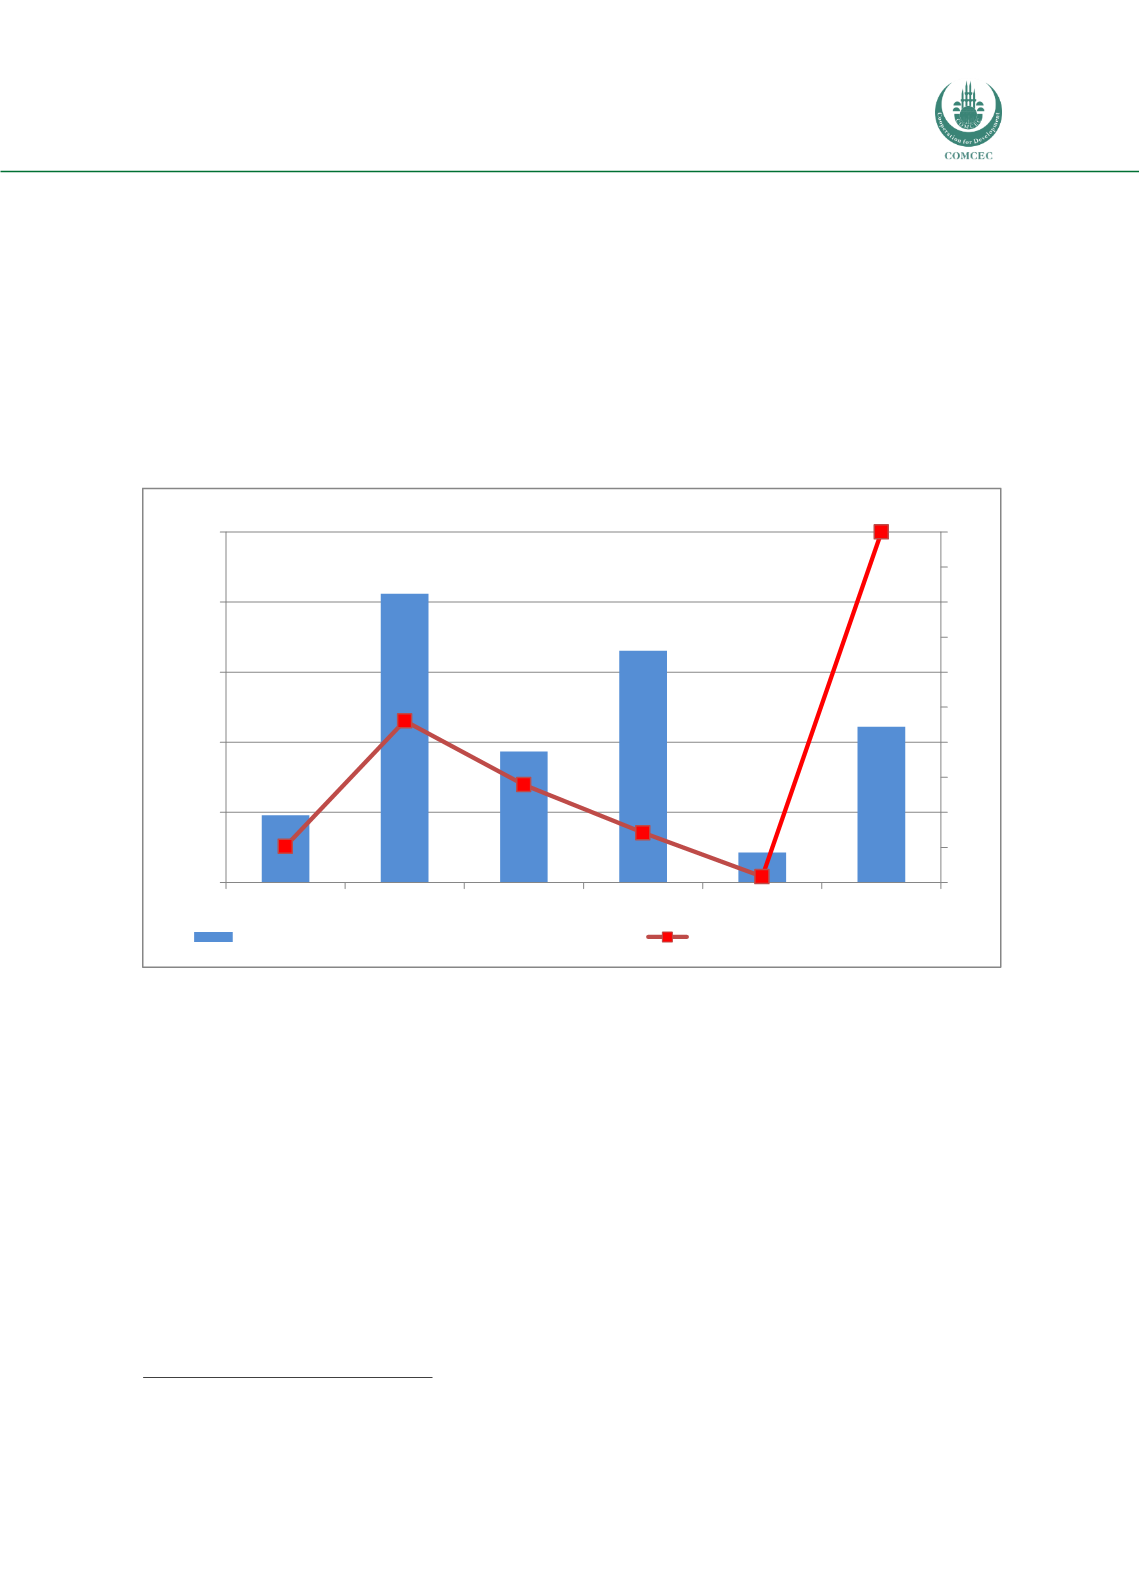
Figure 21. Renewable Water Potential in the World (2013-2017)
Source: FAOSTAT
According to FAO data, total renewable water resources in the world have been declining, and
it is calculated as 54,705 km
3
/year for the period 2013-2017. The continental distribution of
total renewable water resources can be seen in Figure 21. America has 25,203 km
3
/year total
renewable water resources constituting 46.1 percent of the world. Following to America, Asia
and Europe comprise 15,242 km
3
/year and 7,736 km
3
/year total renewable water resources,
respectively. Figure 21 also shows another meaningful indicator which is called renewable
water resources per hectare of agricultural land. It provides adequacy rate of total renewable
water resources with respect to agricultural land of a region. With respect to this indicator,
America, which possesses one fourth of the world’s total agricultural area, has still the most
renewable water resources per hectare of agricultural land with 20,580 m
3
/ha. It can be
explained by its rich water potential. Following to America, Europe, having 9.5 percent of the
world’s total agricultural area, has 16,531 m
3
/ha renewable water for per hectare agricultural
9
UNEP, 2002
10
SESRIC, 2014
4.781
20.580
9.336
16.531
2.129
11.114
10,3
46,1
27,9
14,1
1,6
100,0
0
10
20
30
40
50
60
70
80
90
100
0
5.000
10.000
15.000
20.000
25.000
Africa
Americas
Asia
Europe
Oceania
World
Percent
m
3
/ha
Renewable Water Resources Per Hectare (left axis)
Share of RWR in the World (right axis)