


 77 / 103

COMCEC Agriculture Outlook 2018
66
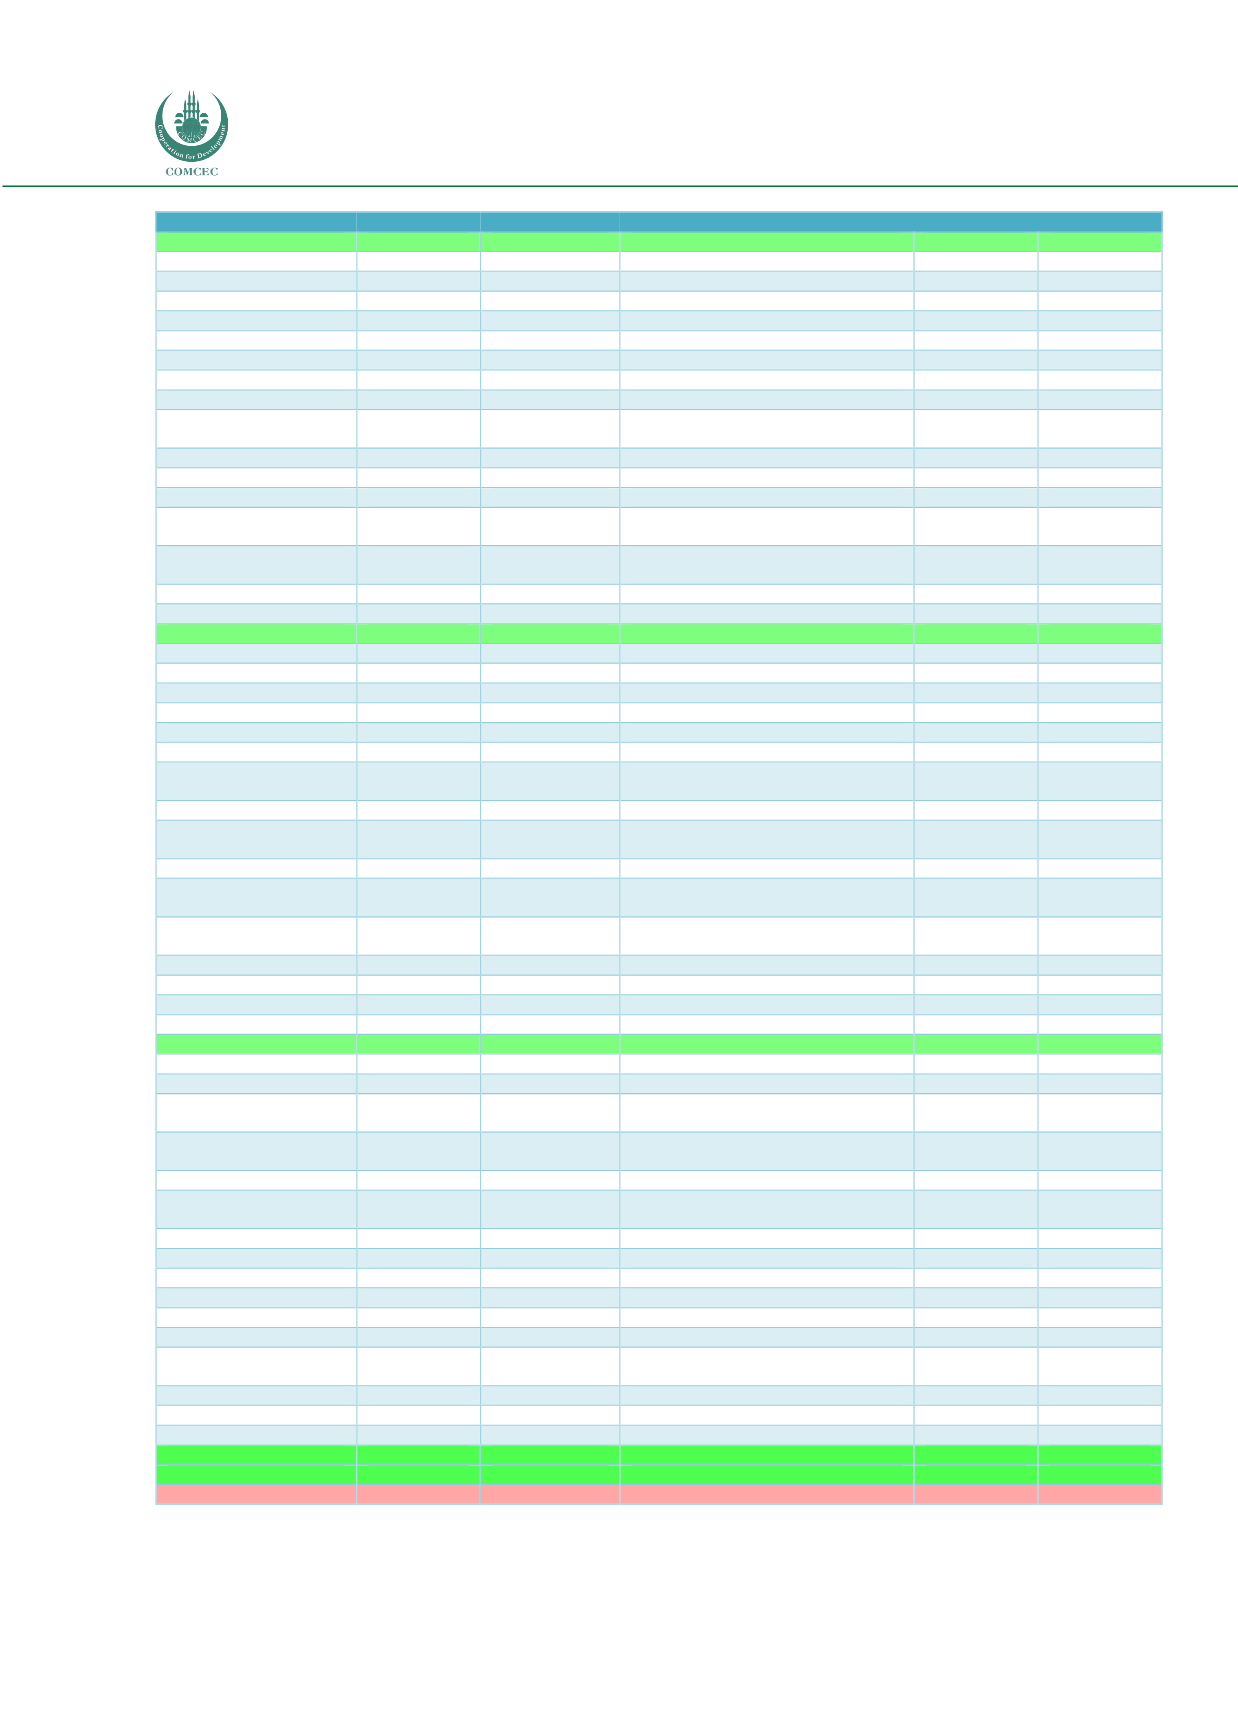
Annex 16: The First 15 Products & Partners in OIC’s Imports, Thousand US Dollars
2016
2017
2016
2017
African Group
14,772,300
16,491,425
African Group
14,772,300
16,491,425
India
1,232,546
1,388,479
Cereals
4,867,614
5,758,639
France
1,329,975
1,331,530
Fish and crustaceans etc.
1,588,237
1,481,211
Thailand
1,255,339
1,289,749
Sugars and sugar confectionery
1,287,745
1,407,731
Brazil
1,207,644
1,083,713
Animal or vegetable fats and oils
1,180,063
1,378,903
United States of America
709,929
888,942
Preparations of cereals, flour, starch
737,652
1,171,473
China
572,353
885,005
Dairy produce; birds' eggs; natural honey
823,452
924,438
Netherlands
713,030
854,978
Miscellaneous edible preparations
748,510
803,866
Russian Federation
496,901
609,847
Beverages, spirits and vinegar
631,135
692,465
Malaysia
450,715
535,433
Tobacco and manufactured tobacco
substitutes
553,170
498,878
Indonesia
396,279
503,869
Products of the milling industry
490,303
441,645
South Africa
514,955
456,066
Meat and edible meat offal
449,232
436,649
Germany
317,064
381,541
Preparations of vegetables, fruit, nuts
255,866
287,260
Argentina
173,263
364,497
Edible vegetables and certain roots &
tubers
324,141
277,716
Senegal
355,941
357,204
Residues and waste; prepared animal
fodder
240,716
243,287
Canada
331,786
340,257
Coffee, tea, maté and spices
153,552
177,850
Share of Group's First 15,%
68.1
68.3
Share of Group's First 15,%
97.0
96.9
Arab Group
107,451,593
104,163,739
Arab Group
107,451,593
104,163,739
Brazil
8,165,261
10,147,562
Dairy produce; birds' eggs; natural honey
17,681,266
18,869,255
India
7,245,855
7,492,885
Meat and edible meat offal
9,792,134
9,160,884
Turkey
6,445,247
6,339,045
Sugars and sugar confectionery
8,386,066
8,355,382
United States of America
5,546,977
6,072,063
Animal or vegetable fats and oils
6,287,776
7,549,394
Argentina
4,674,104
5,279,363
Edible fruit and nuts
6,475,962
7,114,191
France
4,755,324
4,296,475
Preparations of cereals, flour, starch
7,264,396
6,045,420
Russian Federation
2,475,909
4,044,482
Edible vegetables and certain roots and
tubers
5,883,475
5,135,932
United Arab Emirates
5,999,008
3,557,739
Miscellaneous edible preparations
5,485,436
4,767,007
Ukraine
3,187,389
3,520,725
Tobacco and manufactured tobacco
substitutes
4,979,733
4,552,326
Netherlands
2,676,751
3,024,854
Coffee, tea, maté and spices
4,958,052
4,267,118
Saudi Arabia
3,248,342
3,024,500
Oil seeds and oleaginous fruits;
miscellaneous grains
4,136,558
4,225,768
Egypt
3,059,464
2,621,705
Residues and waste ; prepared animal
fodder
3,608,636
3,809,097
Germany
2,976,521
2,576,396
Preparations of vegetables, fruit, nuts
4,045,803
3,586,659
Australia
2,380,998
2,427,655
Live animals
4,001,513
3,199,546
Spain
2,398,771
2,383,377
Beverages, spirits and vinegar
3,227,008
2,893,671
Share of Group's First 15,%
60.7
64.1
Share of Group's First 15,%
89.5
89.8
Asian Group
73,894,492
80,123,166
Asian Group
73,894,492
80,123,166
Brazil
5,736,333
7,381,875
Cereals
11,004,878
12,028,527
United States of America
5,201,552
6,192,224
Animal or vegetable fats and oils
8,735,162
9,440,650
Russian Federation
5,282,940
5,991,371
Oil seeds and oleaginous fruits;
miscellaneous grains
6,608,449
7,297,416
China
4,707,916
5,236,611
Residues and waste; prepared animal
fodder
6,386,799
6,906,784
Indonesia
4,192,575
4,883,034
Sugars and sugar confectionery
5,450,453
6,261,061
Australia
4,171,193
4,740,449
Edible vegetables and certain roots and
tubers
4,406,524
4,453,268
India
3,244,761
4,283,843
Edible fruit and nuts
4,026,355
4,173,882
Argentina
3,738,488
3,935,567
Dairy produce; birds' eggs; natural honey
3,034,012
3,388,033
Thailand
3,062,728
3,591,316
Miscellaneous edible preparations
3,149,639
3,376,184
Ukraine
2,731,759
3,021,395
Meat and edible meat offal
2,320,128
2,918,219
Malaysia
2,613,743
2,936,095
Cocoa and cocoa preparations
2,705,664
2,853,401
Canada
2,351,437
2,022,446
Coffee, tea, maté and spices
2,506,828
2,711,040
Kazakhstan
1,530,522
1,670,228
Tobacco and manufactured tobacco
substitutes
2,420,142
2,507,680
New Zealand
1,359,714
1,574,563
Preparations of cereals, flour, starch
2,134,517
2,374,010
Netherlands
1,501,610
1,281,711
Live animals
1,549,230
2,072,894
Share of Group's First 15,%
69.6
73.3
Share of Group's First 15,%
89.9
90.8
First 15 Total
126,720,912
136,822,664
176,983,982
182,276,710
OIC
196,118,385
200,778,330
196,118,385
200,778,330
World
1,430,402,615
1,545,144,397
1,430,402,615
1,545,144,397
Source: TRADEMAP- Table includes the agricultural and food products excl. agricultural raw materials