


 162 / 164

COMCEC
Malnutrition in the OIC Member
Countries: A Trap for Poverty
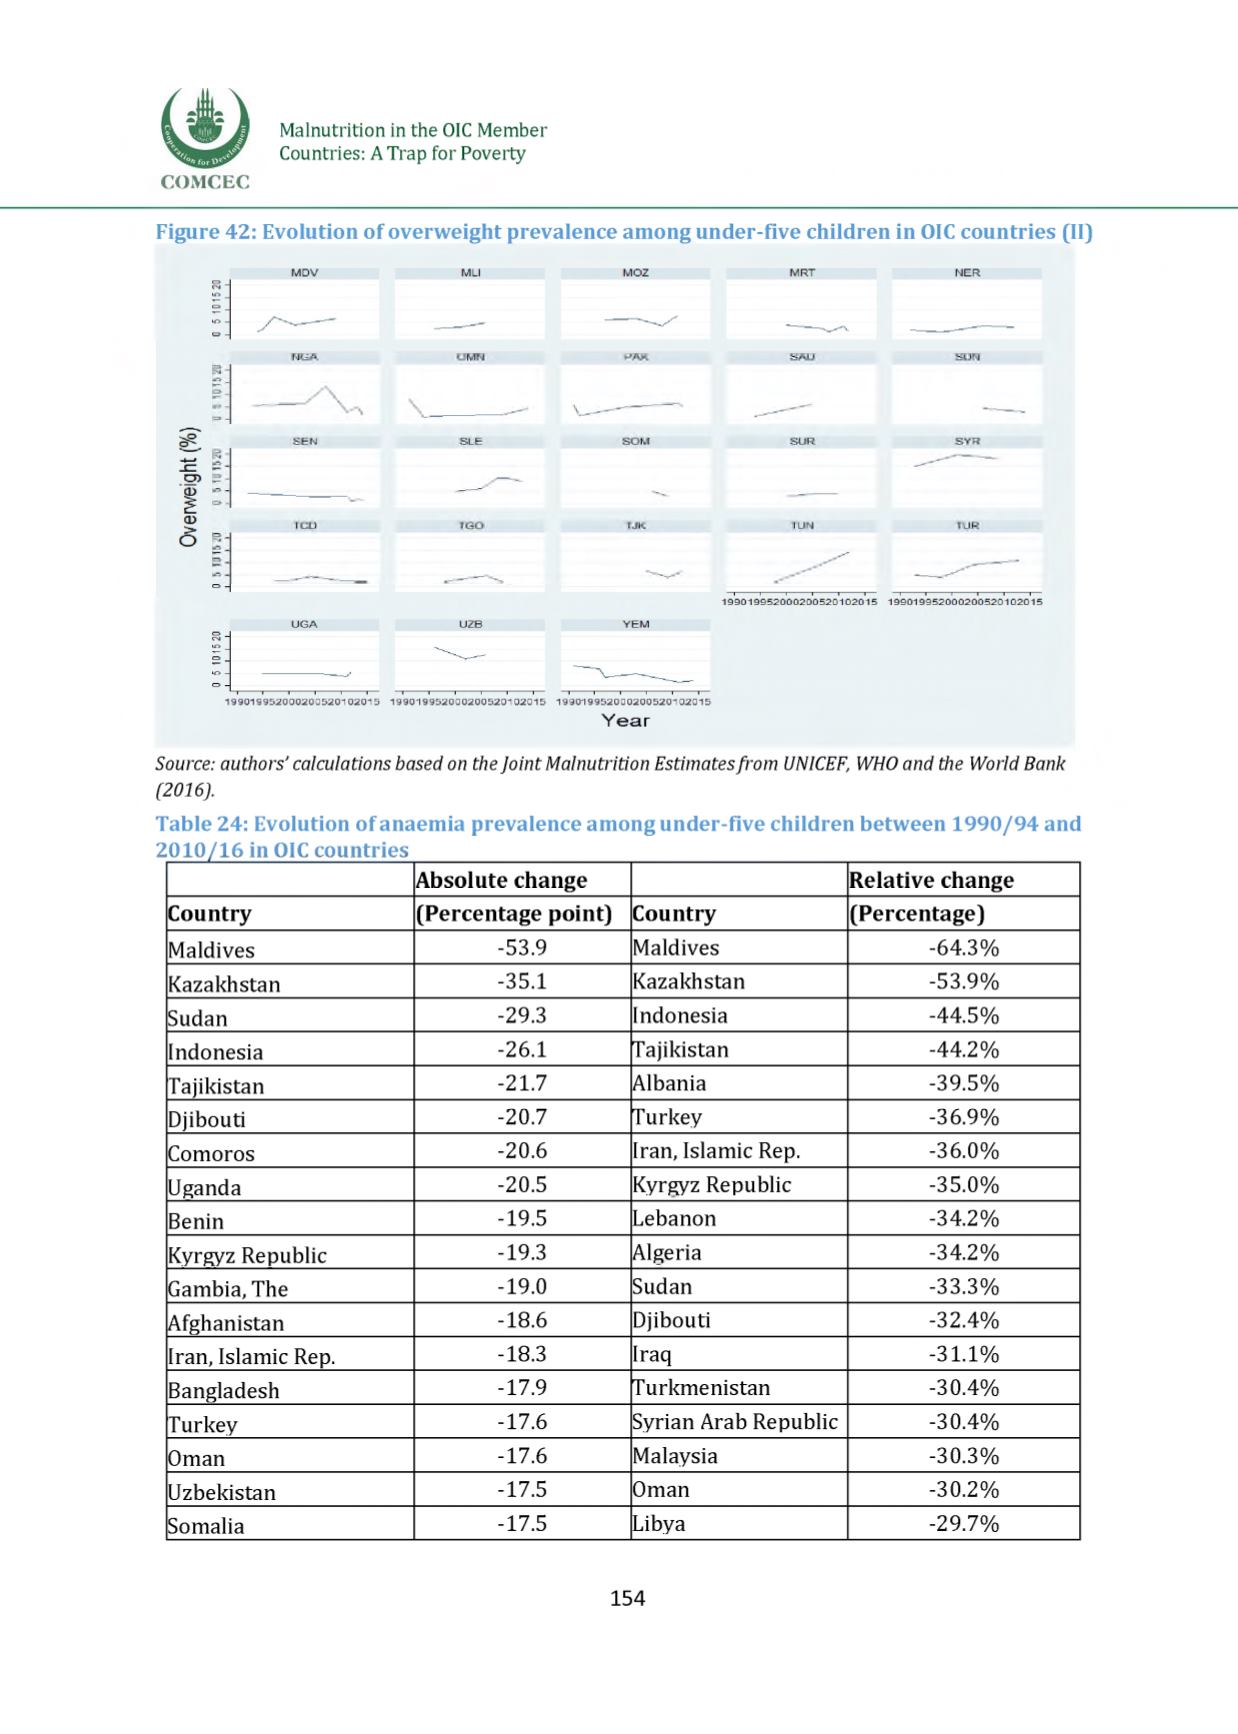
Figure 42: Evolution of overweight prevalence among under-five children in OICcountries (II)
199019952000200520102015 199019952000200520102015 199019952000200520102015
Y e a r
Source: authors' calculations based on the Joint Malnutrition Estimatesfrom UNICEF, WHOand the World Bank
(2016).
Table 24: Evolution of anaemia prevalence among under-five children between 1990 /94 and
2010 /16 in OIC countries
Absolute change
Relative change
Country
(Percentage point) Country
(Percentage)
Maldives
-53.9
Maldives
-64.3%
Kazakhstan
-35.1
Kazakhstan
-53.9%
Sudan
-29.3
Indonesia
-44.5%
Indonesia
-26.1
Tajikistan
-44.2%
Tajikistan
-21.7
Albania
-39.5%
Djibouti
-20.7
Turkey
-36.9%
Comoros
-
2 0 .6
Iran, Islamic Rep.
-36.0%
Uganda
-20.5
Kyrgyz Republic
-35.0%
Benin
-19.5
Lebanon
-34.2%
Kyrgyz Republic
-19.3
Algeria
-34.2%
Gambia, The
-19.0
Sudan
-33.3%
Afghanistan
-18.6
Djibouti
-32.4%
Iran, Islamic Rep.
-18.3
Iraq
-31.1%
Bangladesh
-17.9
Turkmenistan
-30.4%
Turkey
-17.6
Syrian Arab Republic
-30.4%
Oman
-17.6
Malaysia
-30.3%
Uzbekistan
-17.5
Oman
-30.2%
Somalia
-17.5
Libya
-29.7%
154