


 89 / 108

81
Furthermore, the public sector is still less efficient in allocating health expenditure than the private
sector (Chahed et al., 2014).
Furthermore, some disparities still exist among different geographic and socio-economic groups. For
example, Coastal areas seem to be more equipped than the western part of the country. The number
of doctors and specialists, the quality of medical equipment as well as the overall coverage of services
is lower in the western regions of the country too (Chahed et al, 2014). One of the general concerns is
the low number of hospital beds in health facilities that correspond to the people of each area.
According to WHO, the hospital beds ratio in 2015 was 2.3 per 1,000 people, which is still lower than
the global average and the average of other middle-income countries.
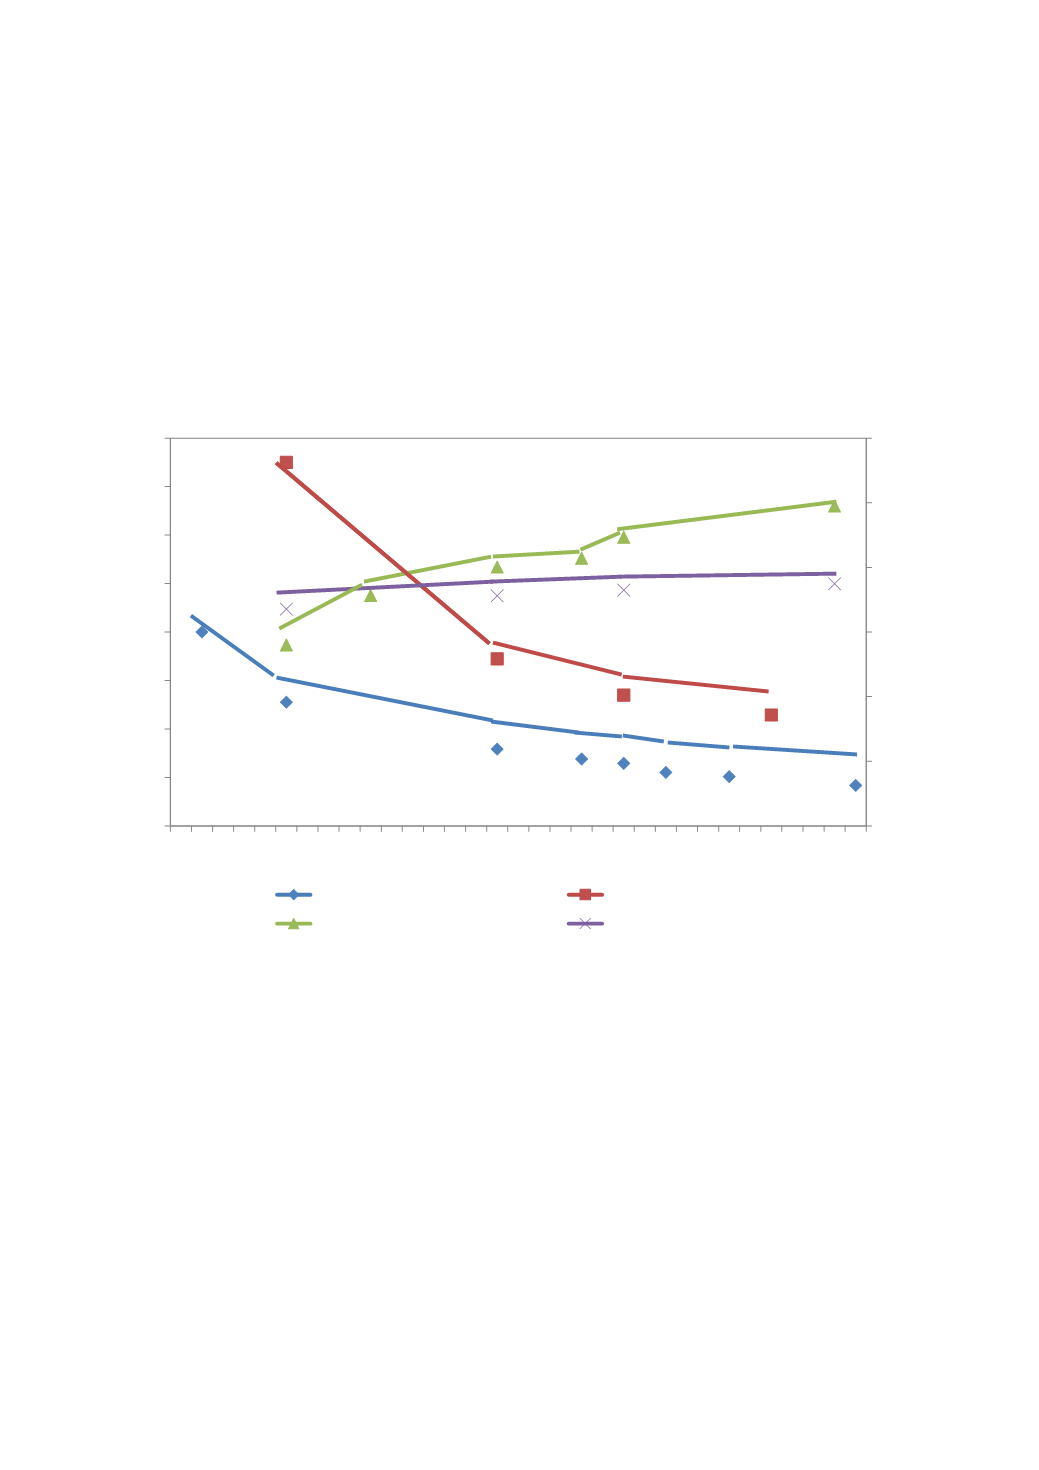
Figure 39: Trends of Tunisian’s demographic indicators (1980-2012)
Source: Chahed et al. (2014)
Access to health services by Tunisia’s poor
Tunisia has established a health insurance mechanism to improve access to health services by the
underserved parts of the population. Since 1960, Tunisia implemented a social protection systemwith
two “components”, or two public medical aid schemes addressed at the poorest and more vulnerable
population groups. The first component of Tunisia’s Free Medical Assistance
for the Poor (FMAP)
scheme covers the poorest with free health care. Eligibility is determined depending on local poverty
lines and regional quotas. The second component of FMAP covers those groups of the poor who
experience low living conditions or earn below minimum wage/certain wage threshold but are not
eligible to be exempt of all health fees. These groups benefit from a reduced-fee plan where certain
services are subsidised. Although poverty rates have fallen significantly from
25.4 per cent in 2000 to
15.2 per cent in 2015 (OECD, 2018), 24 per cent of the population is still enrolled in either of these two
schemes (Chahed et al., 2014).
However, it is important to remember that almost 10 per cent of the population are not covered by
any kind of insurance which means that they are burdened with the whole amount of their needed
80
51
31,7
27,6 25,8
22,1 20,3
16,7
150
68,9
54
45,8
67,1
71,2
73
74,9
0
20
40
60
80
100
120
0
20
40
60
80
100
120
140
160
1980 1982 1984 1986 1988 1990 1992 1994 1996 1998 2000 2002 2004 2006 2008 2010 2012
infant mortality
maternal mortality
assisted childbirth
life expectancy
89,3
99,0
82,8
80,1
71,3
56,0