


 244 / 253

232
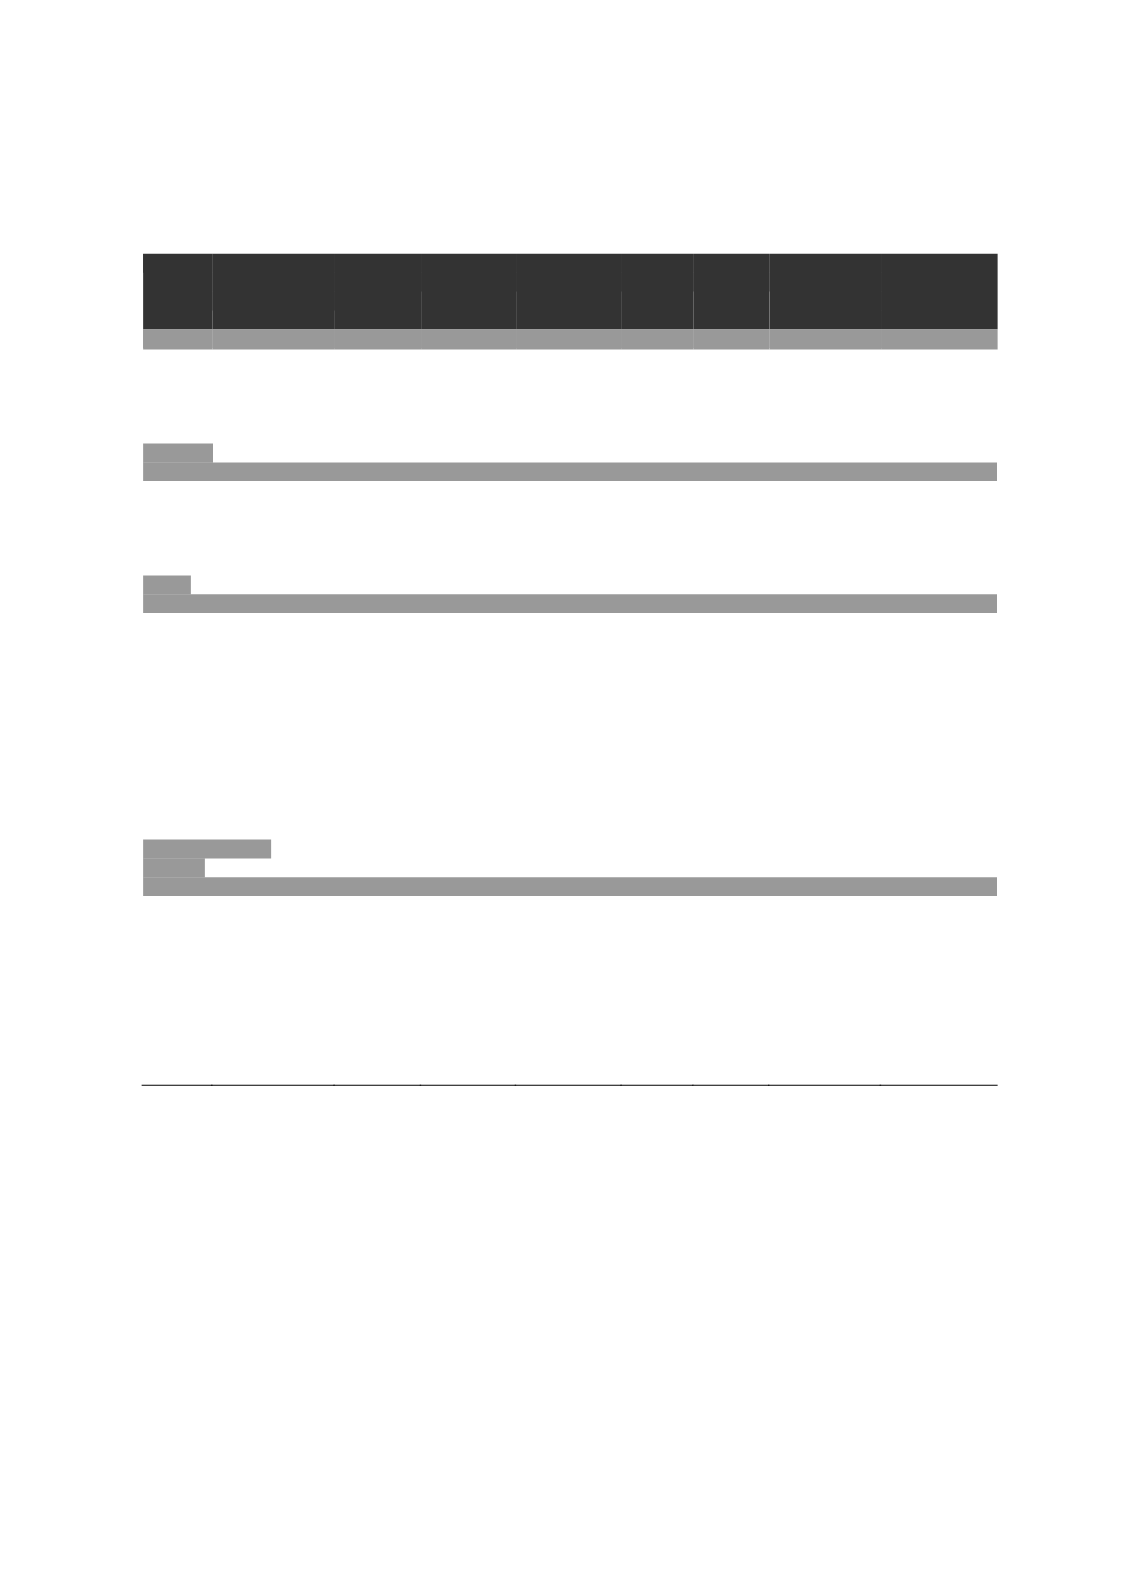
Appendix Table B2: Reasons for choice of JSS in Nigeria
Closest to
space
available
Better
School
Less
Expensive
Religio
n
Safer
School
Othe
r
Don't
Know/missing
Number
of
childre
n
Sex
Male
35.
7
45.
1
15.4
0.8
0.7
2.2
0.1
5,513
Female
30.
0
49.
4
16.2
1.9
0.7
1.8
0.0
5,141
Residence
Urban
22.
9
55.
2
17.3
1.6
0.8
2.2
0.0
6,170
Rural
46.
7
36.
2
13.7
1.0
0.5
1.8
0.1
4,484
Region
North
Central
38.
5
46.
8
11.0
1.6
0.2
1.8
0.0
1,574
North
East
53.
9
36.
0
8.4
1.0
0.3
0.4
0.1
809
North
West
49.
0
33.
2
14.5
2.7
0.1
0.6
0.0
1,776
South
East
27.
3
57.
3
9.3
1.5
1.5
3.1
0.0
1,487
South-
South
25.
6
41.
1
30.3
0.5
0.9
1.3
0.1
2,200
South
West
22.
3
59.
0
13.5
1.0
0.8
3.4
0.0
2,808
Economic Status
Quintile*
Lowest
58.
7
32.
1
7.2
0.1
0
1.6
0.2
586
Second
55.
8
29.
1
12.9
1.2
0.2
0.8
0
1,490
Middle
44.
0
35.
6
16.9
1.4
0.4
1.7
0.0
2,357
Fourth
28.
3
47.
4
18.7
1.8
0.8
3.0
0.1
2,830
Highest
14.
6
65.
7
15.3
1.2
1.1
2.0
0.0
3,390
Source: NPC & RTI (2016)