


 91 / 214

Improving Transnational Transport Corridors
In the OIC Member Countries: Concepts and Cases
77
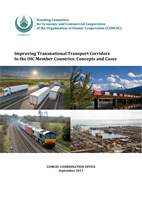
Table 11: Trade matrix TRACECA
Source: Fimotions (2017), analysis on data o
n www.trademap.org .However, with many landlocked countries, parts of TRACECA is likely to be used much also for
trade with third parties. The intra trade of the selected routes is shown i
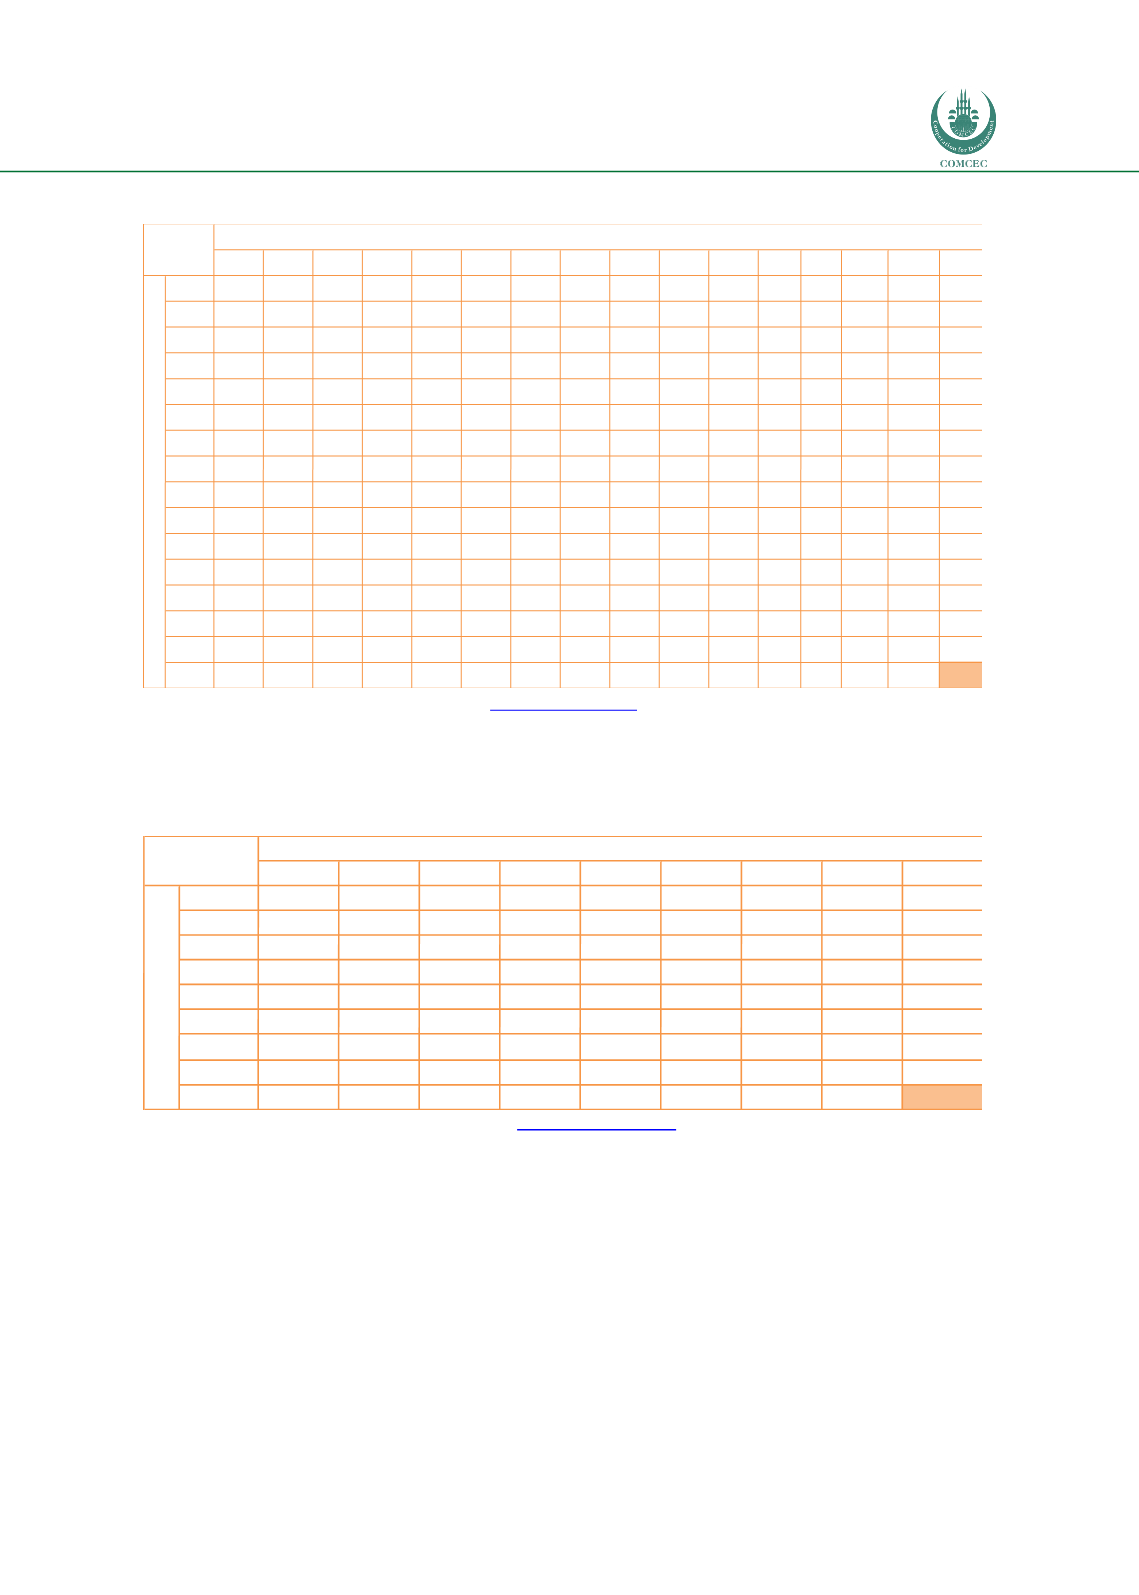
n Figure 28.Table 12: Trade matrix TRACECA routes T19-T22 and T24 countries
Source: Fimotions (2017), analysis on data o
n www.trademap.org .However, with many landlocked countries, parts of TRACECA is likely to be used much also for
trade with third parties. The intra trade of the selected routes is shown i
n Figure 28.AZER ARME BULG GEOR IRAN KAZA KYRG MOLD ROMA TAJ
TURKEY UKRA UZBE Total
World %
AZER
N/A
N/A
449
139
10
1
0
0
2
458
69
62
1,191 12,642 9.4%
ARME
2
152
142
75
6
1
0
27
1
0
8
2
417 1,776 23.5%
BULG
12
20
184
76
17
2
21 2,290
2 2,090
82
14
4,809 26,088 18.4%
GEOR
153
151
167
47
40
7
2
37
6
174
73
71
928 2,114 43.9%
IRAN
N/A
N/A
N/A
N/A
N/A
N/A
N/A
N/A
N/A
N/A N/A N/A
-
46,068 0.0%
KAZA
106
0
47
19
551
376
18
724
372
851 911 923
4,900 36,775 13.3%
KYRG
1
0
5
3
8
151
0
2
22
90
3 125
410 1,423 28.8%
MOLD
5
1
76
17
1
13
2
513
1
62
50
6
745 2,045 36.4%
ROMA
44
3 2,047
194
369
64
4
832
0 2,017 444
19
6,038 63,581 9.5%
TAJ
0
0
0
0
N/A
218
6
0
0
162
3 N/A
390
673 58.0%
TURKEY
1,286
0 2,384 1,177 4,969
625
309
262 2,672
152
1,254 533
15,623 142,606 11.0%
UKRA
319
102
419
403
534
713
76
524
570
30 2,772
174
6,635 36,736 18.1%
UZBE
6
2
2
9
N/A
588
70
3
1
N/A
709
62
1,446 6,983 20.7%
Total
1935
277 5300 2598 6767 2445
854 1664 6836
587 9385 2959 1929 43,529
World
7097 3230 28875 7236 46237 25175 3844 4020 74605 3223 198602 38199 9163
379,510
%
27.3% 8.6% 18.4% 35.9% 14.6% 9.7% 22.2% 41.4% 9.2% 18.2% 4.7% 7.7% 21.1%
11.5%
COUNTRY
Imports (Million USD)
Exports (Million USD)
AZER ARME GEOR TURKEY TURKM UZB
Total
World
%
AZER
N/A
449.13 457.50 13.10 61.67
981 12,637 7.8%
ARME
2.26
142.46
0.48
5.24
1.84
152 1,776 8.6%
GEOR
153.46 150.65
173.57 10.35 71.30
559 2,114 26.5%
TURKEY
1,285.84
0.00 1,177.09
1,245.51 533.32
4,242 142,606 3.0%
TURKM
19.62
6.23 75.48 422.49
N/A
524 7,415 7.1%
UZB
6.23
1.56
9.26 709.29
N/A
726 6,984 10.4%
Total
1,467
158 1,853 1,763 1,274
668 7,185
World
7,157 3,230 7,236 198,602 4,664 9,141
173,531
%
20.5% 4.9% 25.6% 0.9% 27.3% 7.3%
4.1%
Country
Imports (Million USD)
Exports (Million USD)