


 43 / 214


Improving Transnational Transport Corridors
In the OIC Member Countries: Concepts and Cases
29
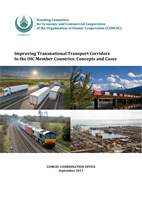
Figure 9: Global energy use in transportation (left) and use of biofuels in different modes
(right) according to the BLUE map energy Scenario
Source: IEA (2010).
Among the alternative fuel technologies examined in this study, the BLUE Map Scenario
awards the greatest share to biofuels, forecast to account for 27% of the total estimated energy
consumption for transportation by 2050, predominantly for road transportation, but also for
aviation and shipping.
Typically, these objectives can be achieved by shifting to less emission-heavy modes of
transportation and also by better load factors in freight transportation (Kopp et al., 2012). The
greenhouse gas emissions per ton-kilometer (km) for a freight train can be less than 30% of
those of trucks and passenger train emissions per passenger-kilometer are less than 40% of
those for passenger cars. Increased use of rail transport can therefore help reduce harmful
emissions (Asian Development Bank, 2017).
In 2008 the European Commission released its first handbook on estimation of external costs
(accidents, air pollution, climate change, noise, nature and landscape, biodiversity losses, soil
and water pollution, and urban effects) in the transport sector. This handbook provided
quantifications and monetary values by the European Union member country and by mode of
transport. For freight transport, the average external costs in 2008 for EU-27 (excluding
congestion) are presented in
Table 1.Rail and waterborne freight transport modes have 14 –
22% lower external costs than road transport.
Table 1: Average external costs for freight transport in 2008 for EU-27
High scenario
(€/1,000 ton-
kilometer)
Low scenario
(€/1,000 ton-
kilometer)
Road
50.5
36.1
Rail
7.9
5.3
Waterborne
11.2
7.7
Source: (Asian Development Bank, 2017)
The building and operation of infrastructure accounts for only about 1% of the total energy
consumption of transport as a whole. However, this part indirectly affects emissions from
2%
8%
30%
2%
15%
26%
15%
2%
Global energy use in transport sector in 2050 (%)
Electricity
Hydrogen
Biofuels
CNG & LPG
Gasoline
Diesel
Jet Fuel
Heavy fuel oil
37%
26%
26%
11%
Use of biofuels in different modes in 2050 (%)
Road passenger
Road freight
Aviation
Shipping