
FACILITATING INTRA-OIC TRADE:
Improving the Efficiency of the Customs Procedures in the OIC Member States
104
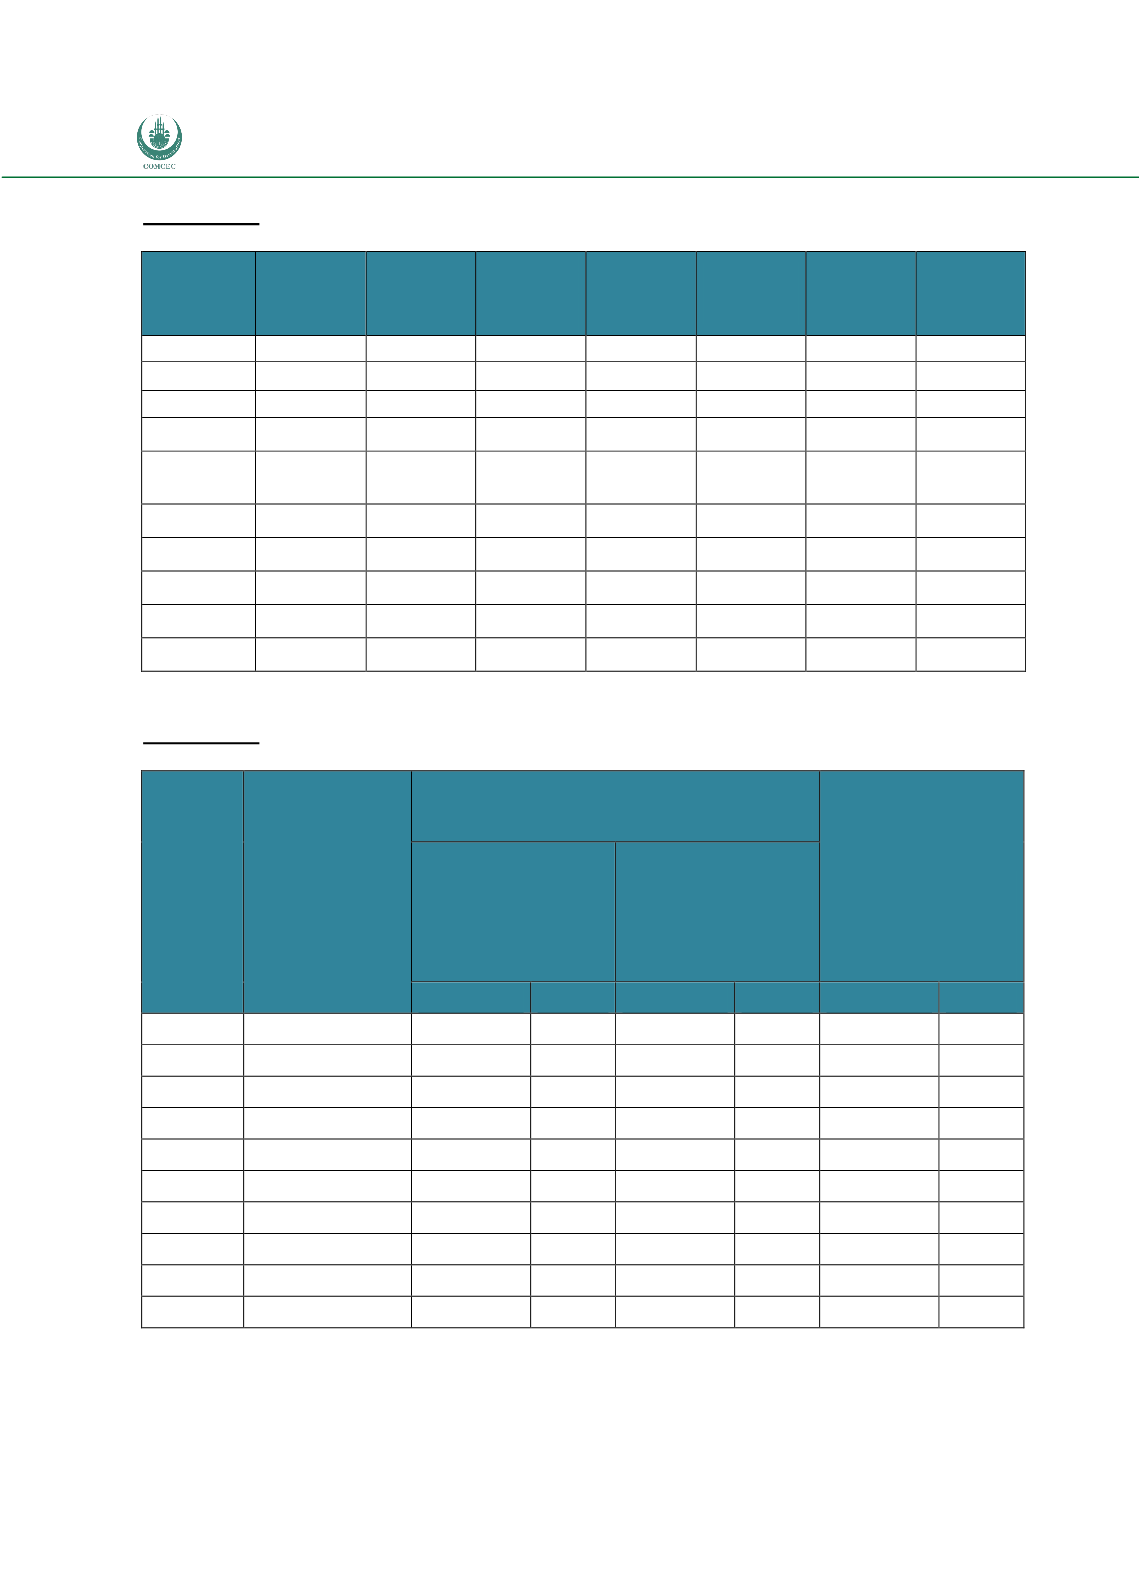
Appendix 4: Best 10 Performer OIC Member States in 2013 in Trading Across Borders
Index
Country
Documents
to export
(number)
Time to
export
(days)
Cost to
export (US$
per
container)
Documents
to import
(number)
Time to
import
(days)
Cost to
import (US$
per
container)
Ranking
UAE
3
7
655
5
7
615
4
Malaysia
4
11
450
4
8
485
5
Tunisia
4
13
775
6
17
860
31
Morocco
5
11
595
7
16
970
37
Brunei
Darussalam
5
19
705
5
15
770
39
Oman
7
10
745
8
9
680
47
Indonesia
4
17
615
8
23
660
54
Jordan
5
13
825
7
15
1.235
57
Djibouti
5
20
885
5
18
910
60
Qatar
5
17
885
7
17
1.033
67
Source: Doing Business Report 2014
Appendix 5: Best 10 Performer OIC Member States According to the “Efficiency of
Customs Administration” Pillar of the Enabling Trade Index
No:
Country
Efficiency of Customs Administration
Ranking of the
Efficiency of
Customs
Administration
Burden of customs
procedures, 1–7 (best)
Customs services
index, 0–12 (best)
Ranking Score
Ranking Score
Ranking Score
1.
Bahrain
8
5,5
19
9,8
12
5,7
2.
UAE
7
5,6
30
9,3
17
5,6
3.
Saudi Arabia
22
5
34
8,8
29
5,1
4.
Albania
62
4,2
36
8,7
38
4,6
5.
Morocco
46
4,4
42
8,2
39
4,6
6.
Tunisia
39
4,6
N.A.
N.A.
42
4,6
7.
Azerbaijan
101
3,5
28
9,3
46
4,5
8.
Malaysia
25
5
70
6,6
47
4,5
9.
Uganda
48
4,4
55
7,5
51
4,4
10.
Jordan
68
6,8
52
4,4
65
4,2
Source: Global Enabling Trade Report 2012


