
Reviewing Agricultural Trade Policies
To Promote Intra-OIC Agricultural Trade
161
Brazil’s top 5 export product groups to the OIC countries are subject to average tariffs varying
between 9.9 percent (dairy products) and 20 percent (oils, fats, waxe) (Table 4.63).
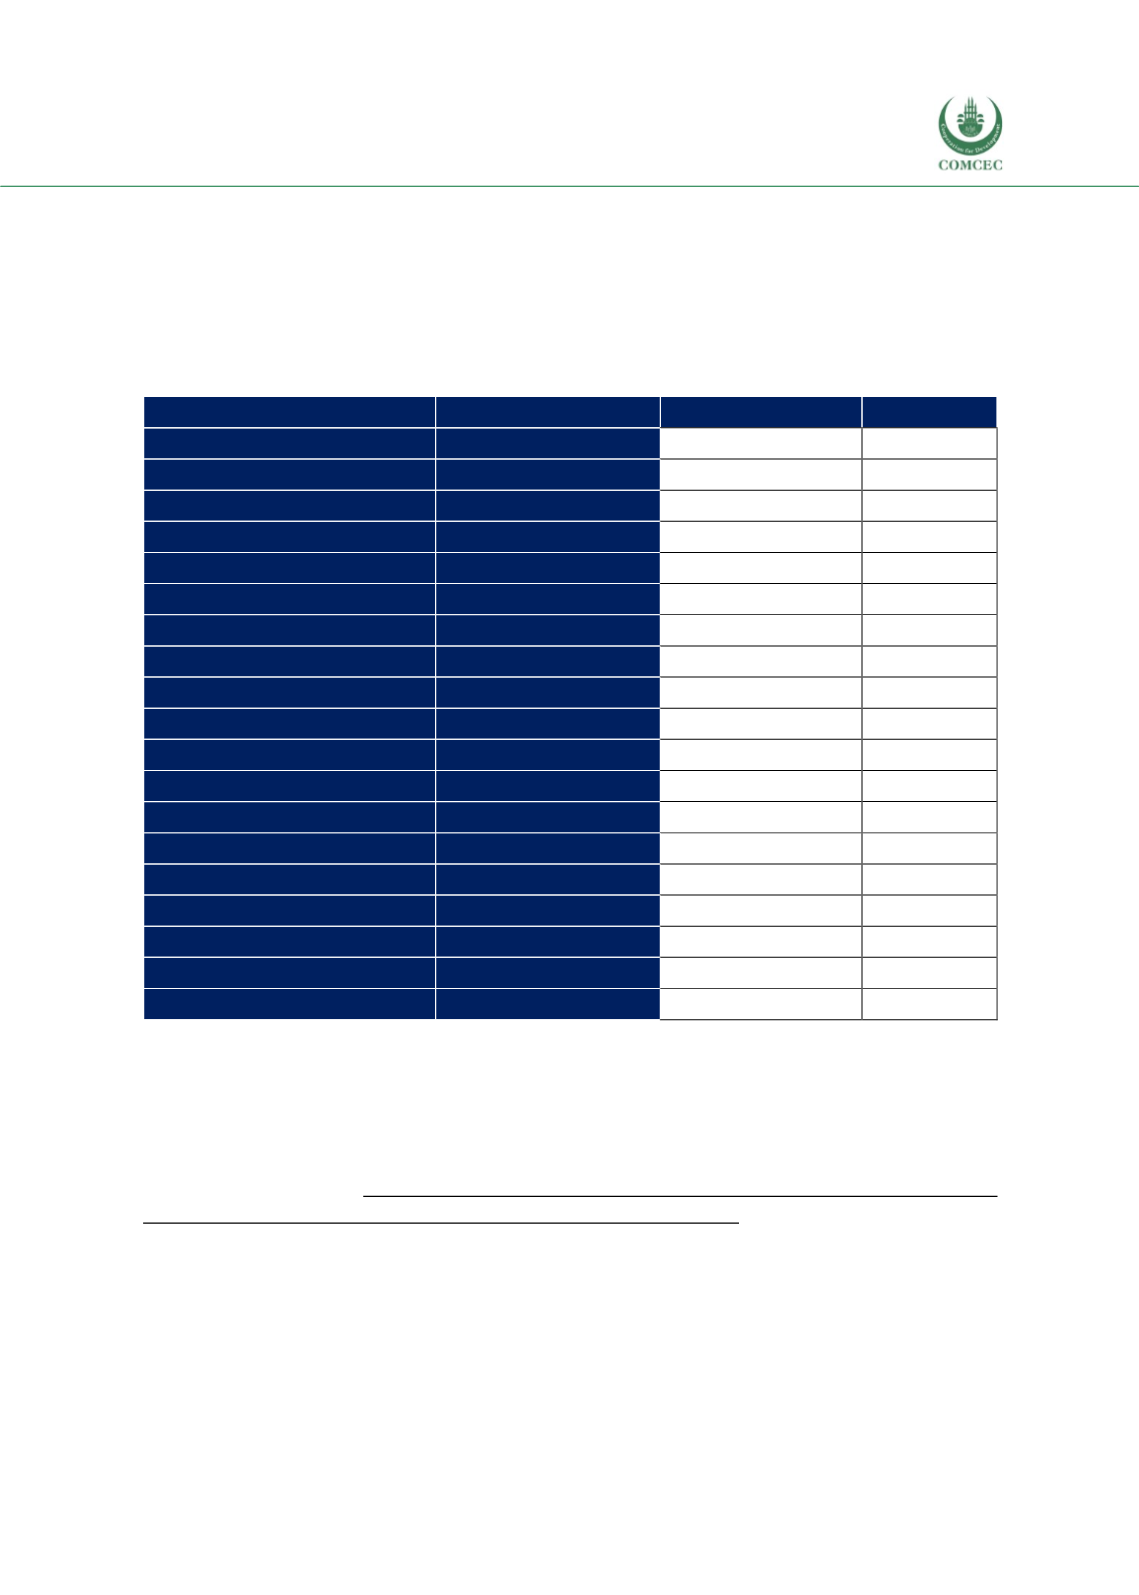
Tables 4.64 and 4.65 show the place of NTMs in Brazil’s agricultural trade. In the former table,
NTM types and product shares and counts affected from NTMs are shown. Vegetables and food
products are the categories most highly protected by NTMs, while wood products are the least.
Around 75 percent of animal products and hides and skin imports are subject to NTMs.
Table 4. 64 NTM Types and NTM Affected Products, Brazil
Sector
NTM Type
Share %
Count
Animal
1 type
20.8
70
Animal
2 types
22.9
77
Animal
3+ types
31.0
104
Animal
No NTMs
25.3
85
Vegetable
1 type
6.8
24
Vegetable
2 types
1.4
5
Vegetable
3+ types
85.8
302
Vegetable
No NTMs
6.0
21
Food Products
1 type
4.3
9
Food Products
2 types
11.4
24
Food Products
3+ types
77.3
163
Food Products
No NTMs
7.1
15
Hides and Skins
1 type
33.3
23
Hides and Skins
2 types
31.9
22
Hides and Skins
3+ types
8.7
6
Hides and Skins
No NTMs
26.1
18
Wood
1 type
9.4
22
Wood
2 types
33.2
78
Wood
No NTMs
57.5
135
Source: WITS
All animal products’ imports are subject to NTMs in the form of sanitary and phyto sanitary
measures as well as technical barriers to trade in addition to their exports benefiting from
export related measures. The other NTMs are insignificant in animal products imports. For
vegetables, all imports are subject to phyto sanitary measures as well as technical barriers to
trade. Food products are also highly protected by those two types of NTMs in addition to two
third being protected by pre-shipment inspection and other formalities. Hides and skins are also
protected, the most liberal product category being wood products.
4.7. Conclusions and Lessons Learned
Several messages emerge from the case study analyses presented in this chapter. This
concluding section is devoted to a summary of these results and lessons. Table 4.66 presents a
summary of what is learned from the case studies presented above.


