
Reviewing Agricultural Trade Policies
To Promote Intra-OIC Agricultural Trade
138
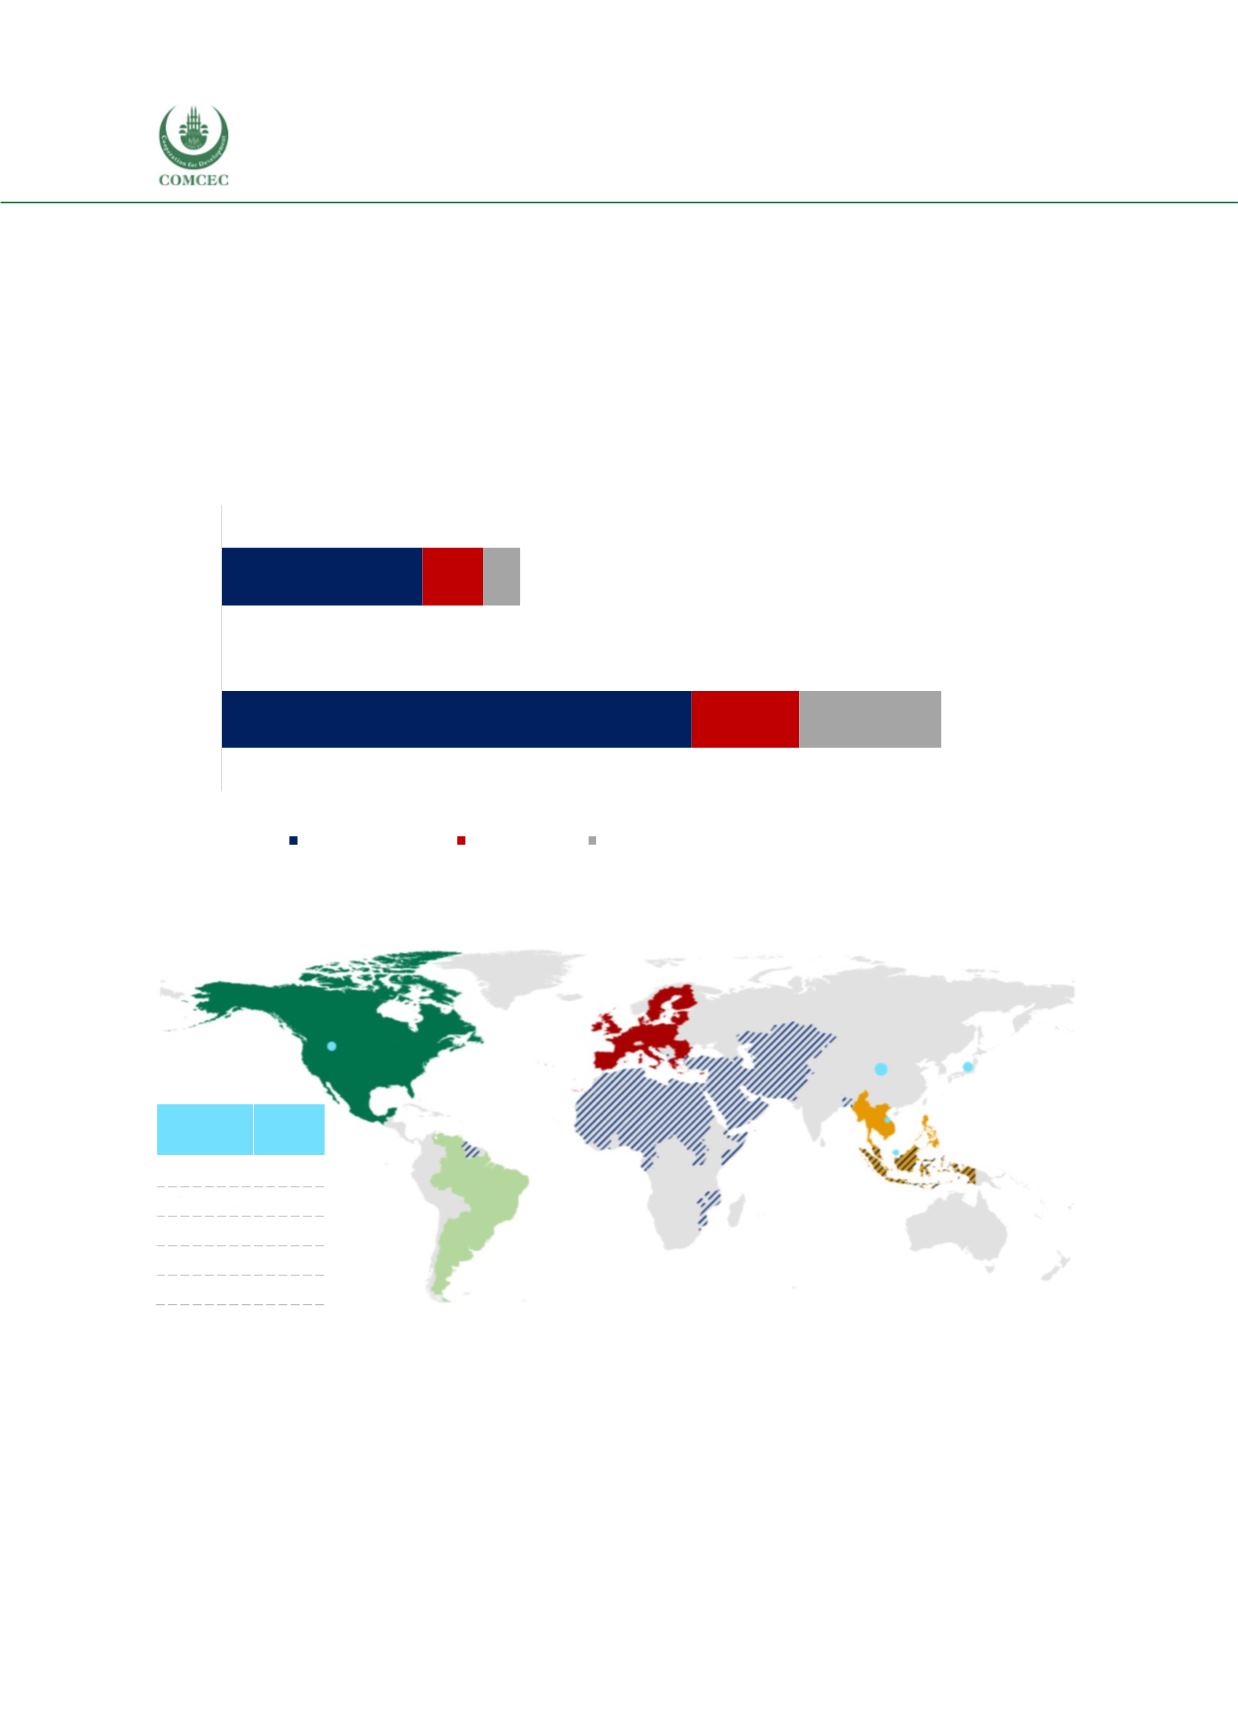
Exports of agri-food products were 24.2 billion USD and imports 10.4 billion USD with
a trade surplus of 13.9 million USD in 2016.
Exports of agricultural raw materials were 7.3 billion USD and imports 1.9 billion USD
with a trade surplus of 5.4 billion USD in 2016.
Exports of fish products were 5.5 billion USD and imports 3.1 billion USD with a trade
surplus of 2.4 million USD in 2016 (see Figure 4.49).
Thailand clearly has comparative advantage in all three product groups and manages to sustain
a sizable trade surplus.
Figure 4. 49 Agricultural Exports and Imports, Product Groups, Billion USD, Thailand, 2016
Source: CEPII BACI, Eurostat RAMON, UN Comtrade, UN Trade Statistics, and authors’ calculations
Figure 4. 50 Breakdown of Thailand’s Agricultural Export Destinations, 2016
Source: CEPII BACI, Eurostat RAMON, UN Comtrade, UN Trade Statistics, authors’ visualizations
Agri-food products; 24
Agri-food products; 10
Fish products; 5.5
Fish products; 3.1
Agri-rawmaterials; 7.3
Agri-rawmaterials; 1.9
-
5
10
15
20
25
30
35
40
Export
Import
Agri-food products
Fish products
Agri-rawmaterials
EU-28
%10
NAFTA
%12
MERCOSUR
%0
ASEAN
%24
OIC %17
Top 5
Partner
Share
China
20%
Japan
12%
USA
10%
Malaysia
4%
Viet Nam 4%


