
Enhancing Public Availability of Customs Information
In the Islamic Countries
39
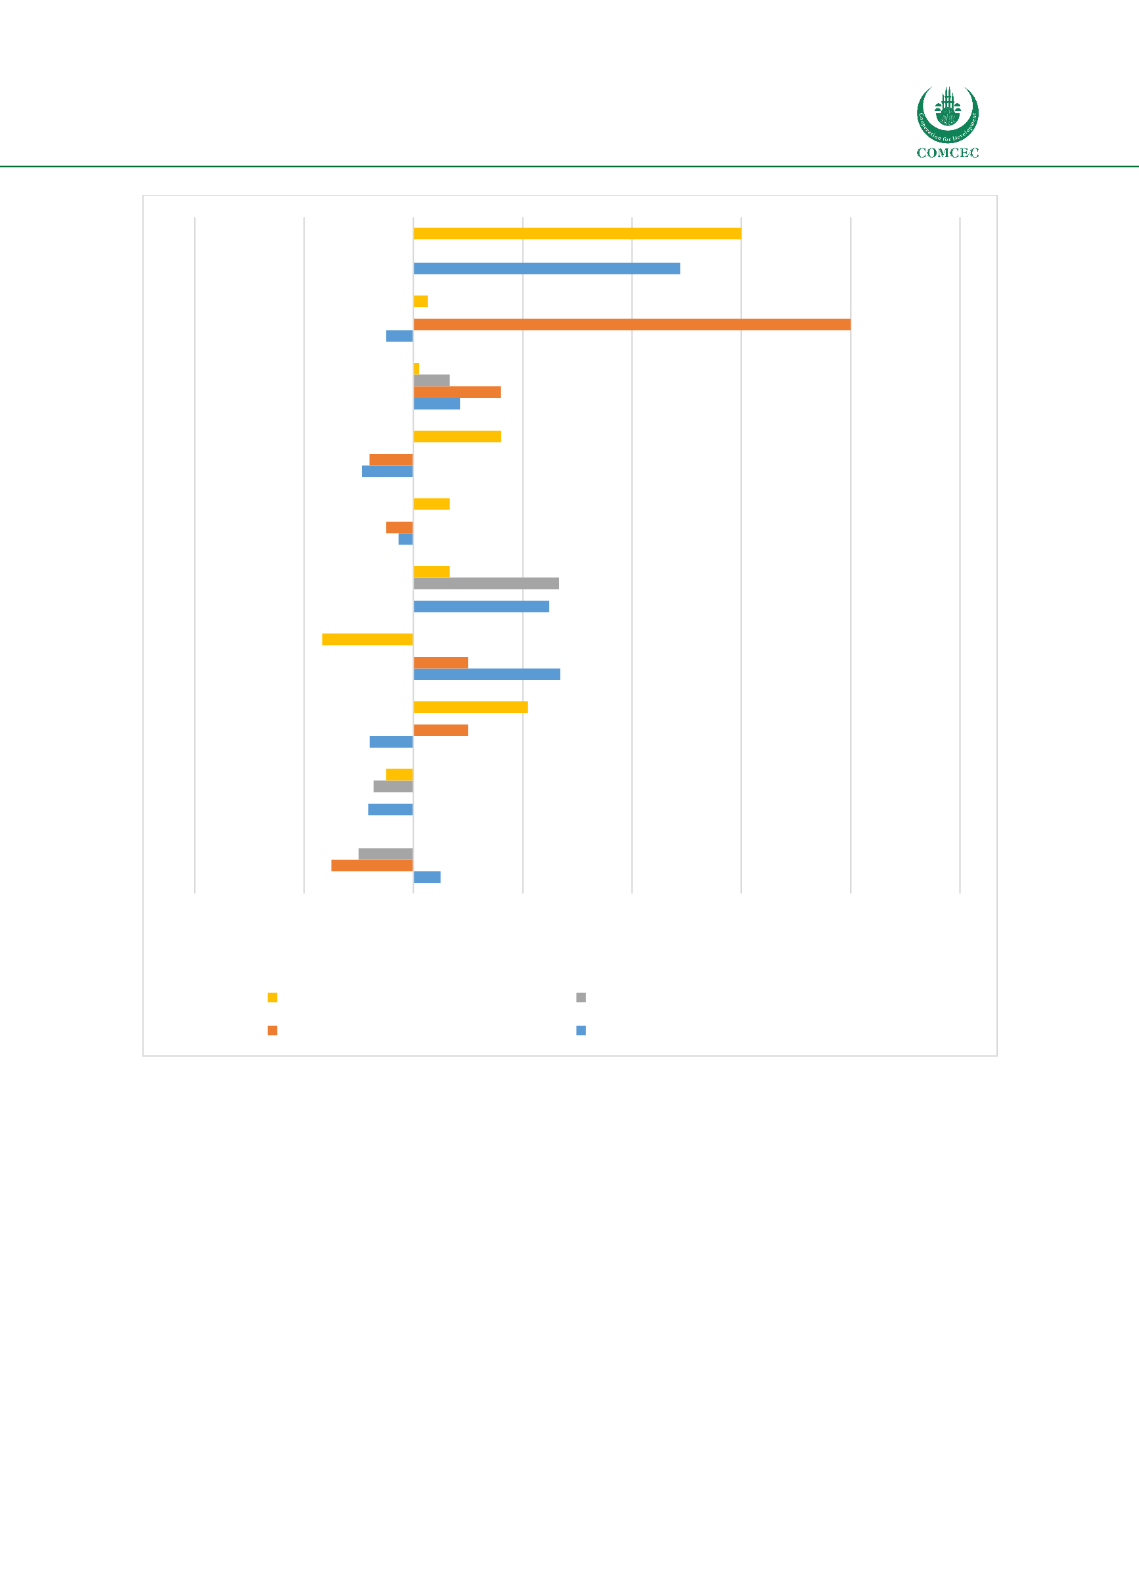
Figure 19: Percentage change in OECD TFIs, Asian Group, 2012-2017.
Source: OECD TFIs.
3.2.
UN Global Survey
As with the previous subsection, this part of the analysis delves into the detail of the UNGS
indicators, focusing on the three OIC regional groups, and then looking at the performance of
individual countries within those groups. As above, the analysis starts with a look at the current
state of play as of 2017, and concludes with an analysis of recent trends in the data. As previously
noted, the UNGS data are only available for 2015 and 2017, so the trend analysis is necessarily
very short term, compared with the more extensive sample available for the TFIs. This
restriction reflects data availability, not the analyst’s choice.
-100
-50
0
50
100
150
200
250
Albania
Azerbaijan
Bangladesh
Brunei Darussalam
Indonesia
Kazakhstan
Kyrgyz Republic
Malaysia
Pakistan
Suriname
Percent
Country
Appeal Procedures
Advance Rulings
Involvement of the Trade Community Information Availability


