
Special Economic Zones in the OIC Region:
Learning from Experience
159
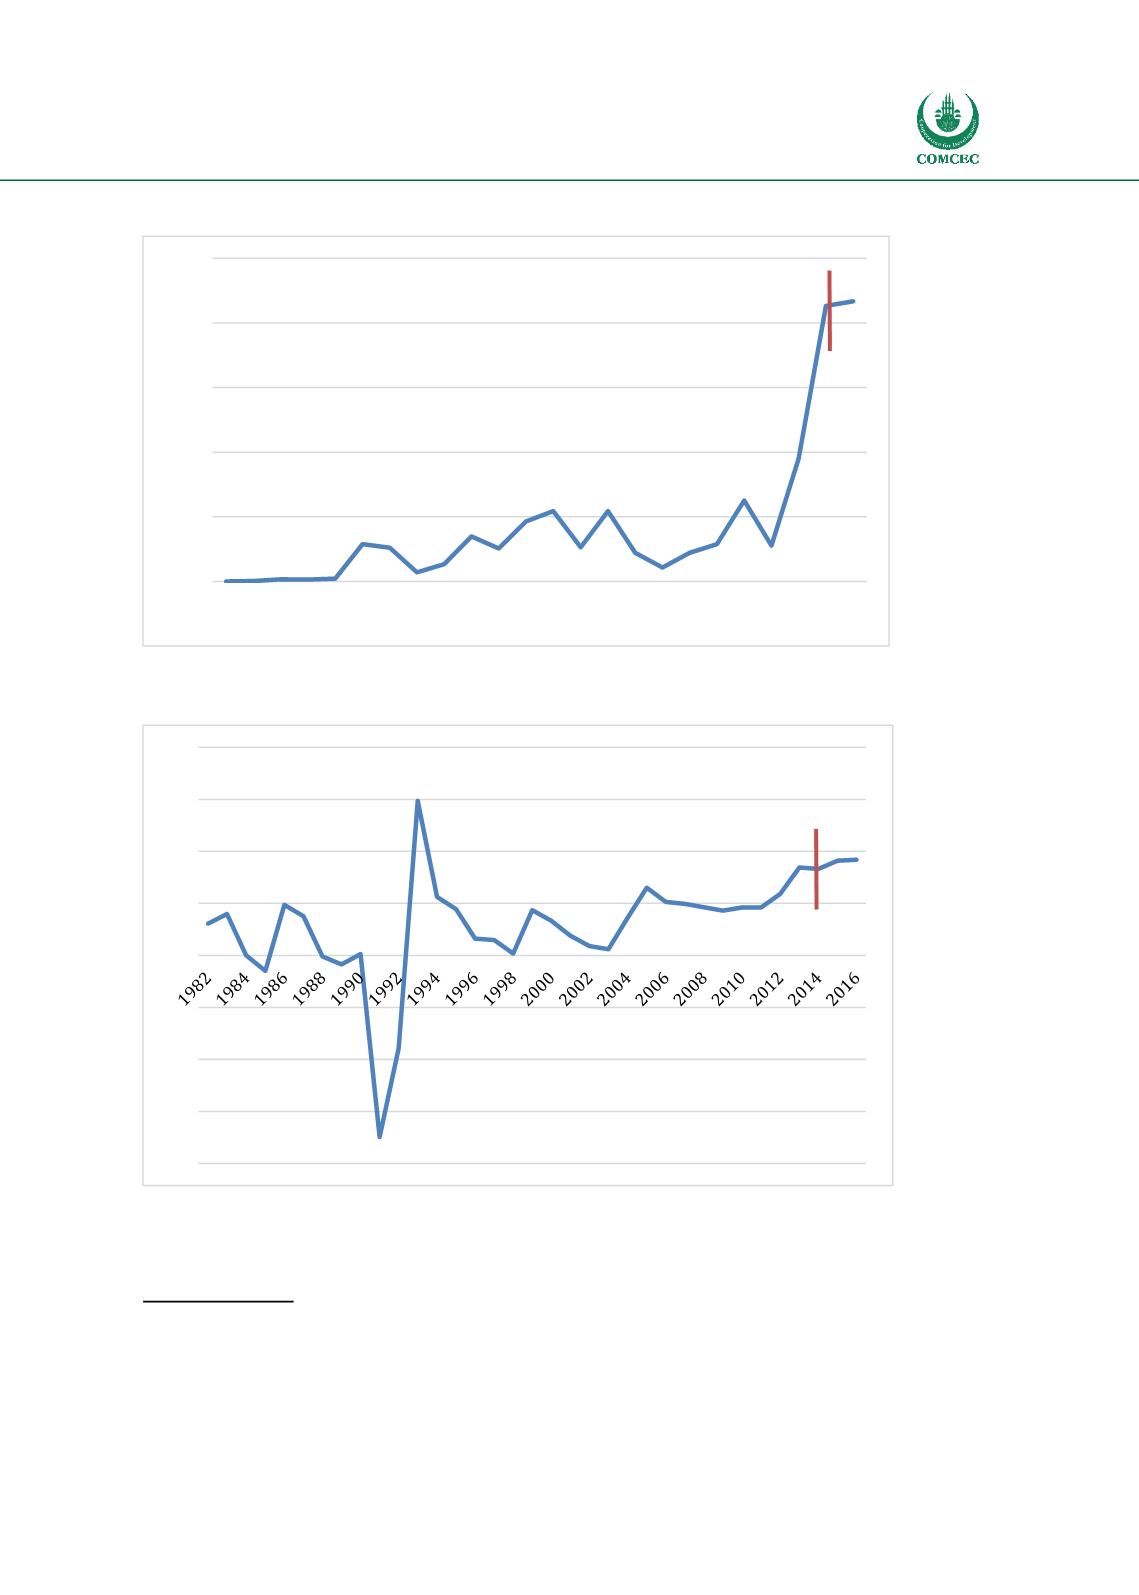
Figure 41 - Foreign Direct Investment – Net Inflows (current $ millions)
Source: World Bank (2017) World Bank Open Data. Available from:
https://data.worldbank.org/Figure 42 - Manufacturing Value Added (annual % growth)
Source: World Bank (2017) World Bank Open Data. Available from:
https://data.worldbank.org/5.7.6
Success Factors and Challenges
Success Factors
Well-coordinated government agencies, particularly the investment promotion
agencies and government departments have facilitated investment in a deliberate and
strong way. The EIC in particular took a methodical approach to understanding
0
500
1000
1500
2000
2500
1992
1993
1994
1995
1996
1997
1998
1999
2000
2001
2002
2003
2004
2005
2006
2007
2008
2009
2010
2011
2012
2013
2014
2015
Opening of Bole Lemi
-40
-30
-20
-10
0
10
20
30
40
Opening of Bole Lemi


