
Special Economic Zones in the OIC Region:
Learning from Experience
150
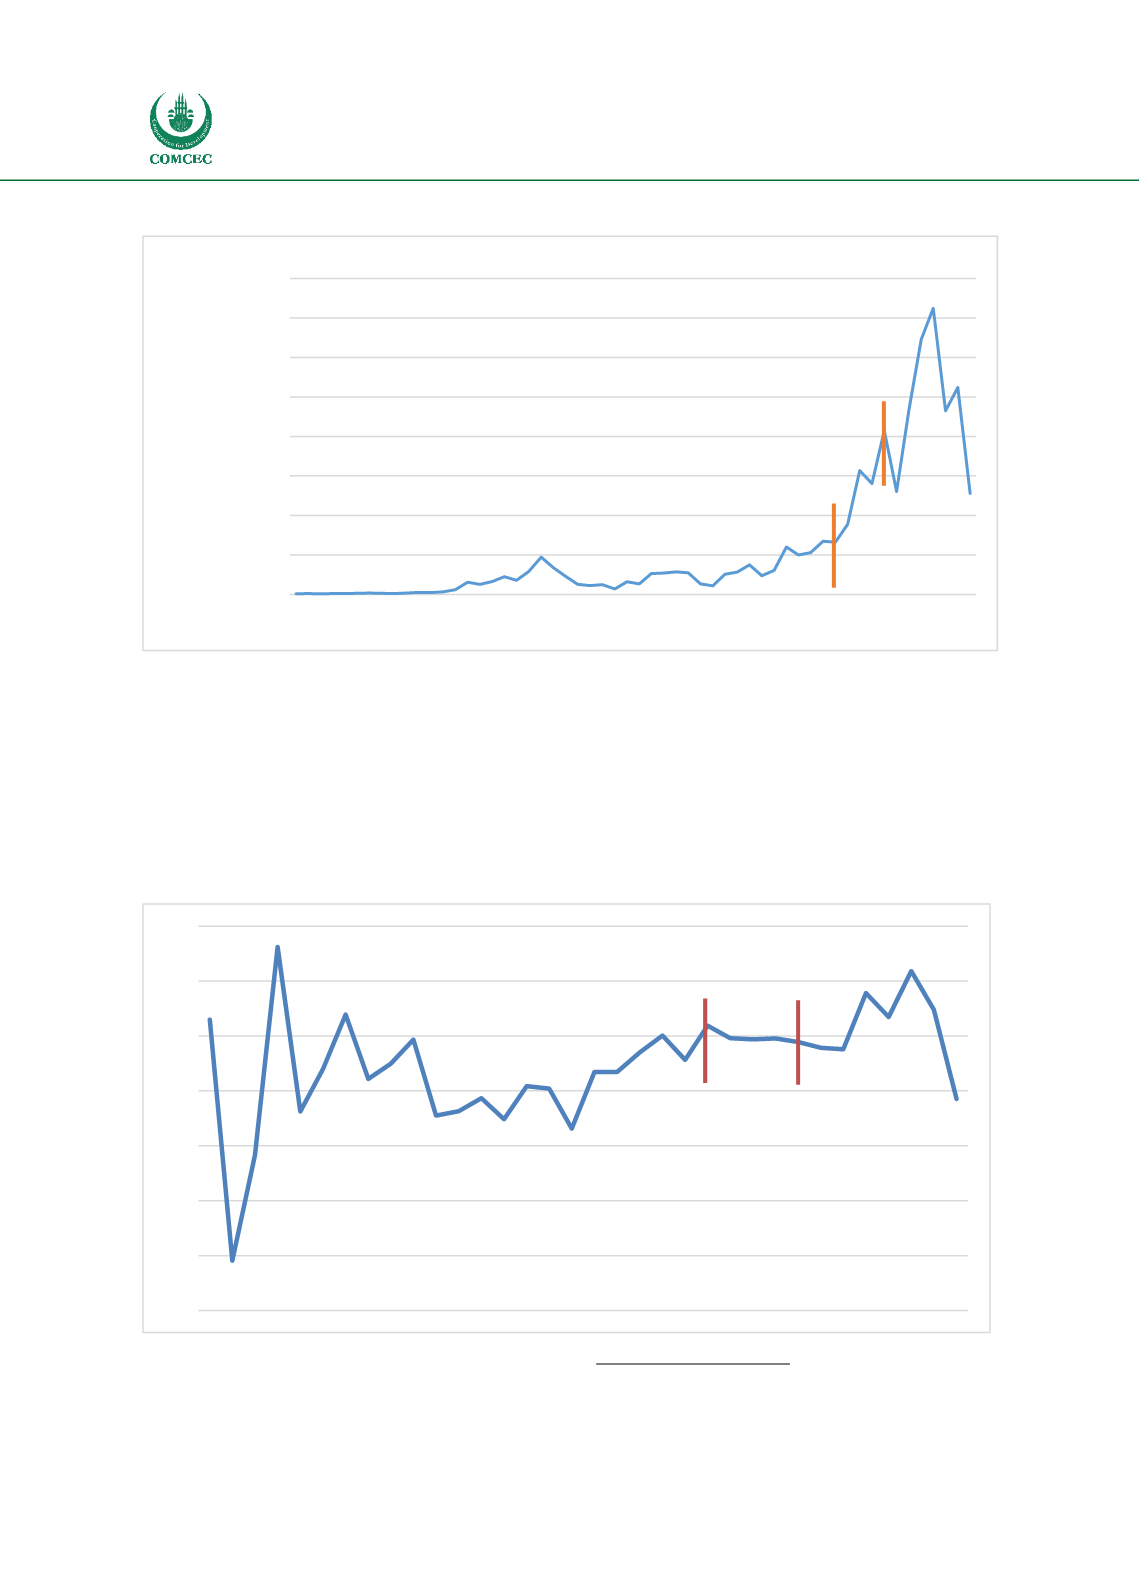
Figure 38 - Nigeria Exports of Goods and Services (current $ Bn)
Source: World Bank (2017) World Bank Open Data. Available from:
https://data.worldbank.org/While much of this can be attributed to investment in the oil sector and exports of oil, there is
also a strong likelihood, particularly between 2010-2015, that the Free Zone programme has
contributed to higher levels of investment and exports. This can be demonstrated by the
growing contribution of manufacturing in the country (see figure below) – a focus area of the
Free Zone programme.
Figure 39 - Manufacturing Value Added (% of GDP)
Source: World Bank (2017) World Bank Open Data. Available from
: https://data.worldbank.org/0.00
20.00
40.00
60.00
80.00
100.00
120.00
140.00
160.00
1960
1962
1964
1966
1968
1970
1972
1974
1976
1978
1980
1982
1984
1986
1988
1990
1992
1994
1996
1998
2000
2002
2004
2006
2008
2010
2012
2014
Passing of Free Zone Law
Opening of Lekki Free Zone
-40
-30
-20
-10
0
10
20
30
1982
1983
1984
1985
1986
1987
1988
1989
1990
1991
1992
1993
1994
1995
1996
1997
1998
1999
2000
2001
2002
2003
2004
2005
2006
2007
2008
2009
2010
2011
2012
2013
2014
2015
Passing of Free Zone Law
Opening of Lekki Free Zone


