
Special Economic Zones in the OIC Region:
Learning from Experience
99
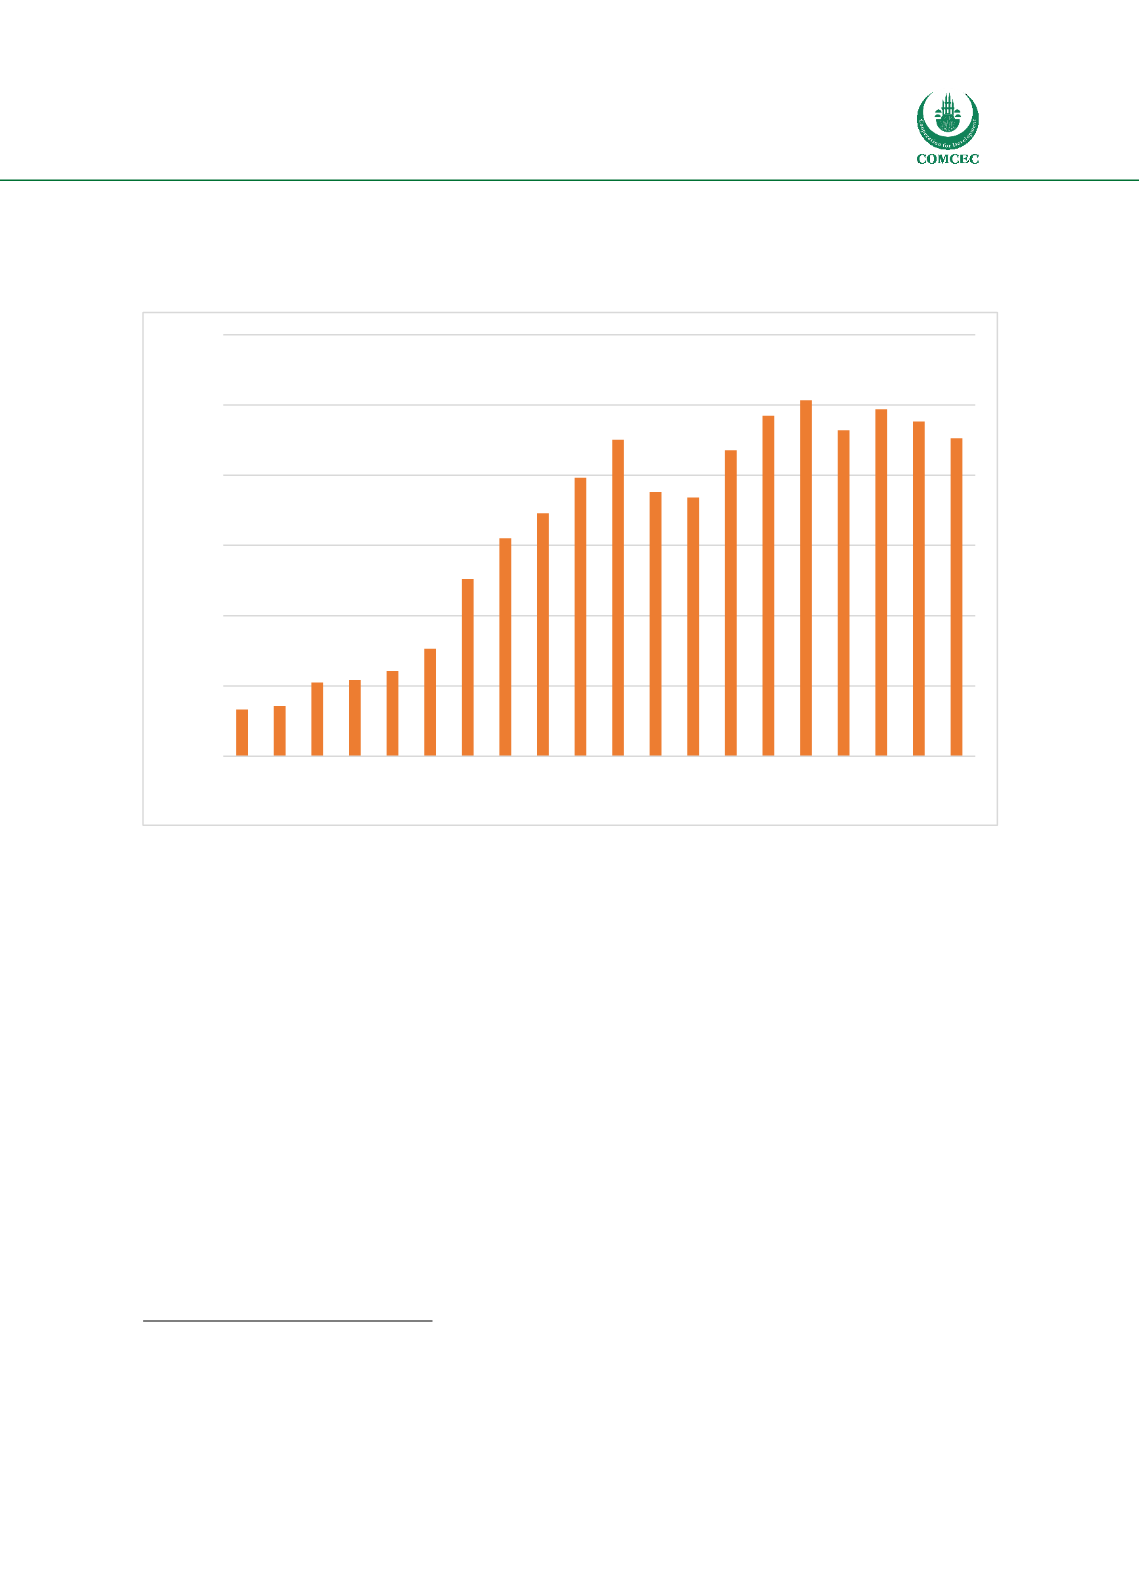
demonstrates, exports of chemical products has increased significantly since the establishment
of Jurong Island in the late 90s.
Figure 22 - Domestic Exports of Chemical Products in Singapore – 1997 to 2016 ($m)
Source: Singapore Statistics (2017) Domestic Exports of Major Non-Oil Products, Monthly
In terms of total output it can be seen that the chemical industry within Singapore contributed
approximately $49 billion in output to the national economy in 2016, comprising approximately
one quarter of total manufacturing output, an increase from approximately 20% in 2000.
95
In addition it can be seen that FDI within the chemical and chemical products sector accounted
for 8% of total manufacturing FDI within Singapore in 2015, and approximately 2% of national
FDI in-flows. Whilst this is a relatively modest contribution, it should be noted that the industry
only accounts for 4% of total manufacturing employment and 3% of total enterprises.
96
5.3.5.1
Relationship with National Economy
To examine the effect of the Jurong SEZ on the Singapore economy a number of indicators have
been examined to illustrate the economic performance of the zone in:
Increasing GDP performance;
95
Singapore Statistics (2016) Total Output by Industry Cluster, Annual.
96
Singapore Statistics (2016) Manufacturing Employment by Industry Cluster / Manufacturing Establishments by Industry
Cluster.
0
10,000
20,000
30,000
40,000
50,000
60,000
1997
1998
1999
2000
2001
2002
2003
2004
2005
2006
2007
2008
2009
2010
2011
2012
2013
2014
2015
2016


